Analytics Quick Start Guide
Quick Start Video
What is Analytics by Liaison?
Analytics by Liaison provides data-driven insights to help you spot trends and shape your class. It gives your school a secure and robust way to explore multi-year applicant and application data using visual representations and dashboards, making it a complete solution for admission offices looking to optimize their efforts for growing or shaping their classes.
Why does Analytics by Liaison matter?
Your applicant data tells the story of your enrollment process. Data, however, in raw numbers, is often difficult to communicate and digest. With many campus stakeholders in line to consume this information, having a vehicle that delivers it visually and is customized to your campus needs is paramount. Here’s how Analytics by Liaison can help you communicate with the following stakeholders:
- Presidents, Provosts, and Deans: Analytics by Liaison provides high-level enrollment and trend data in a visual format, making it easily consumable for an audience that has many demands on time.
- Institutional Research: you can more nimbly and more easily extract yearly and year-over-year data to satisfy state and national survey requests, assist with analysis of outcomes data for annual reports, and contribute data to institutional longitudinal studies.
- Accreditation/Self Study Office: you can use Analytics by Liaison to compile data required for regional and programmatic accreditation requirements, and identify trends to determine if accreditation standards are being met.
- Faculty: Analytics by Liaison gives you an enhanced ability to provide a granular overview of how applicants have changed or remained the same over time and can assist with evaluating whether holistic admissions processes are working. Additionally, Analytics by Liaison can provide information needed to apply for or retain grants.
- Admissions and Enrollment Management: Analytics by Liaison allows you to use actionable data to make decisions and not be mired to data requests.
What are some key benefits of Analytics by Liaison?
- Interactive dashboards enable you to quickly assess your applicant metrics on a single page, including applicant volume, year-over-year changes, key cycle dates, test score distributions, and applicant demographics.
- Use built-in filters to segment and explore your applicant population by legal sex, race and ethnicity, application year, citizenship, and more. Or simply click on the visualizations directly for a more dynamic, interactive filtering experience.
- Define custom cohorts to measure your performance against peers, or use predefined cohorts.
- Export summary or full data in a variety of formats including CSV and crosstab. Export specific data based on custom selections. Save visualizations as images or PDFs that can be easily embedded in presentations.
- Onboard new users quickly and securely using invitations. Delegate administrators in your organization to manage the entire user lifecycle for all of your users.
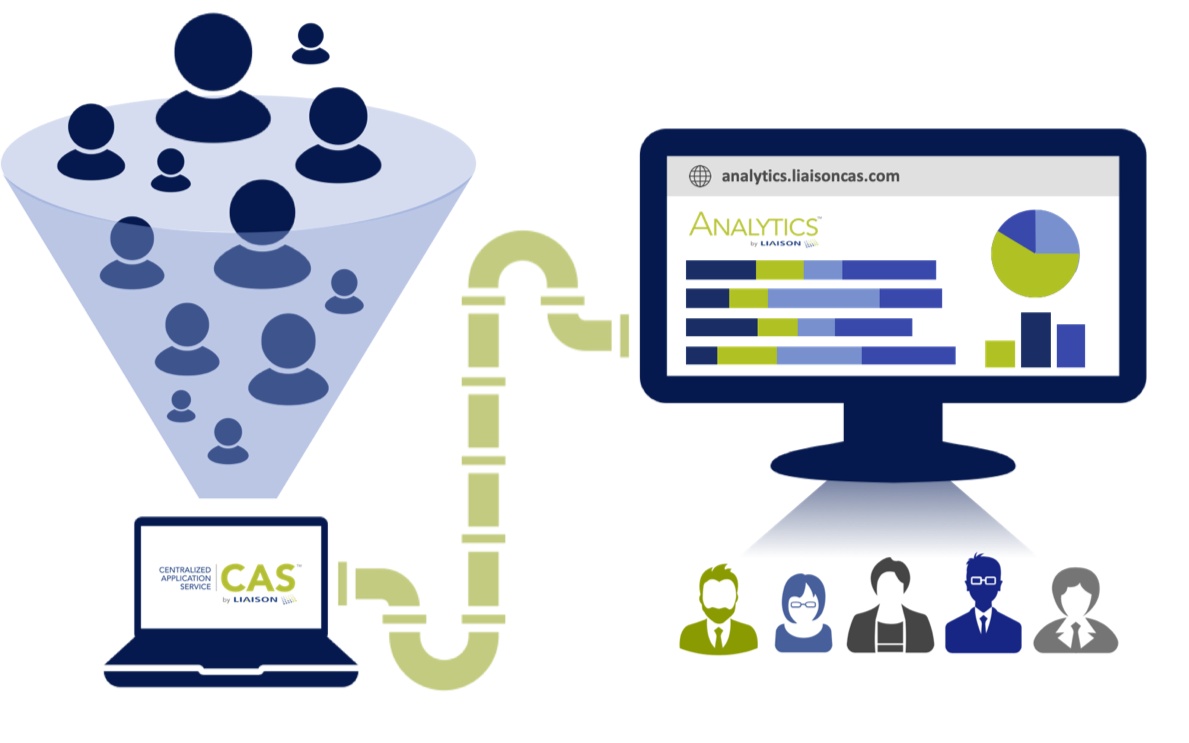
Where does the data come from?
As applicants apply to your program(s), the data that they enter in the Centralized Application Service (CAS) application is collected and fed into Analytics by Liaison, where it’s aggregated and visualized for you. In Analytics by Liaison, data becomes useful information that you can use to manage strategic initiatives and to share with some of the key stakeholders noted above.
How can I use the dashboards?
|
If you need to... |
Then use this dashboard... |
|---|---|
|
Better understand submission trends across cycles |
|
|
Analyze how your applicant pool is growing month-by-month within each cycle, easily compare how many applicants you have in this year (or a given month) versus previous years (or given months), and determine any variances |
|
|
Analyze how your applicant pool is growing week-by-week within each cycle, easily compare how many applicants you have in this year (or a given week) versus previous years (or given weeks), and determine any variances |
|
|
View discrete totals of submitted applicants by month of submission (i.e., the counts for each month do not include the counts from the previous months) |
|
|
View discrete totals of submitted applicants by month of submission against a cohort line that represents the average number of submitted applicants per month across all organizations in the CAS (allowing you to benchmark your program) |
|
|
Benchmark your monthly submitted applicant totals against a custom cohort of five to ten organizations (e.g., top competitors, schools with similar populations, private vs. public, etc.) |
|
|
View the number of submitted designations (i.e., applications that have been paid for and submitted) in each post-submission application status |
|
|
Identify the composition of your applicant pool by legal sex, legal sex by cycle, age groups according to legal sex, and ethnicities and races according to legal sex |
|
|
Identify the composition of your applicant pool by age groups and races and ethnicities |
|
|
Benchmark your applicant pools’ demographic information against CAS averages |
|
|
Identify the states where your domestic students are coming from |
|
|
Identify the countries where your international students are coming from |
|
|
Identify the counties where your domestic students are coming from |
|
|
View how far along your applicants are in completing the Personal Information, Academic History, and Supporting Information sections of the application |
|
| Determine progress through each of the four application quadrants | Section Status |
|
Identify your top domestic and international feeder schools (based on the colleges your applicants self-report as attended) |
|
| Identify the top domestic and international high schools your applicants graduated from (based on the high schools your applicants self-report) | Applicants by High School Attended |
|
View (where applicable) a breakdown of your applicant pool’s:
|
Note: Association users can also access the following dashboards:
The California State University Custom Dashboards
In addition to the core dashboards listed above, Analytics by Liaison users from The California State University have access to a suite of custom reports via the Org Custom Reports tab.
|
If you need to... |
Then use this dashboard... |
And note the following... |
|---|---|---|
|
Compare submitted applications, application volume, and/or applicant volume in the current cycle to the previous two cycles |
Activity Volume |
You can filter the submitted applications by applicant type and campus |
|
Determine which applicants applied to only one campus (i.e., exclusive applicants) or view a summary of all applicants’ ethnicities |
Campus Exclusive Applicants |
You can filter the exclusive applicants by applicant type |
|
Determine the number of shared applicants between two campuses (i.e., the number of applicants who applied to both campus A and campus B, campus B and campus C, etc.) |
Campus Overlap |
You can filter by cycle, applicant type, and term |
|
Compare the number of applicants and applications in the current cycle to the previous cycle |
Cycle Overview |
Applicant and application counts are broken out by applicant type |
|
Compare the following metrics for the current cycle against previous cycles:
|
Current Cycle Compared to Prior Cycles |
|
|
View a daily status of submitted applications to determine whether application submissions are trending above or below the prior cycle |
In Progress and Submitted Applications |
|
|
Compare the number and percentage change of submitted applications by type of applicant in the current cycle to the previous cycle |
Applicant Types by Organization: % Change and Counts |
|
|
View EOP statistics |
EOP Applicants |
|
|
View applicants who've:
|
CCGI Statistics – Applicants |
|
|
View the total count of applicants (by high school) who've:
|
CCGI Statistics – High Schools |
How does Analytics by Liaison compare to WebAdMIT?
It's important to note that Analytics by Liaison and WebAdMIT are two different systems with two distinct purposes. WebAdMIT is used to manage your application process, communicate with applicants, and move them through your workflow, while Analytics by Liaison is used for data analysis and reporting. WebAdMIT stores applicant data and allows you to make admissions decisions, while Analytics by Liaison compiles that data and helps you make sense of it so you can answer strategic questions.