Application Progress Dashboards
Overview
Application Progress Dashboards provide you with a visual representation of how your applicants are progressing through the application. The dashboards are helpful when you need to develop specific communication strategies to encourage completion and submission.
Working with and Downloading Data
As you review the following dashboards, refer to the Working with Dashboard Data page for specific information on:
- Using filters to narrow your data.
- Viewing tooltips to better understand your data.
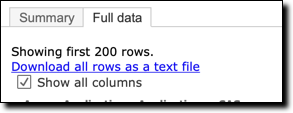
- Viewing and downloading the raw data so you can work with it outside of Liaison Analytics.
Application Progress Dashboard Example Scenario 
Encouraging Applicants to Submit
The application deadline is approaching for Watertown University, and Andrea, the Admissions Director, wants to encourage applicants to submit their applications. She opens the Application Progress dashboard and finds that 237 applicants have completed 90–100% of the application. She downloads the full data set, making sure she selects Show all columns so the data file includes the applicants' email addresses, then she creates a communication strategy to encourage these applicants to complete and submit their applications.
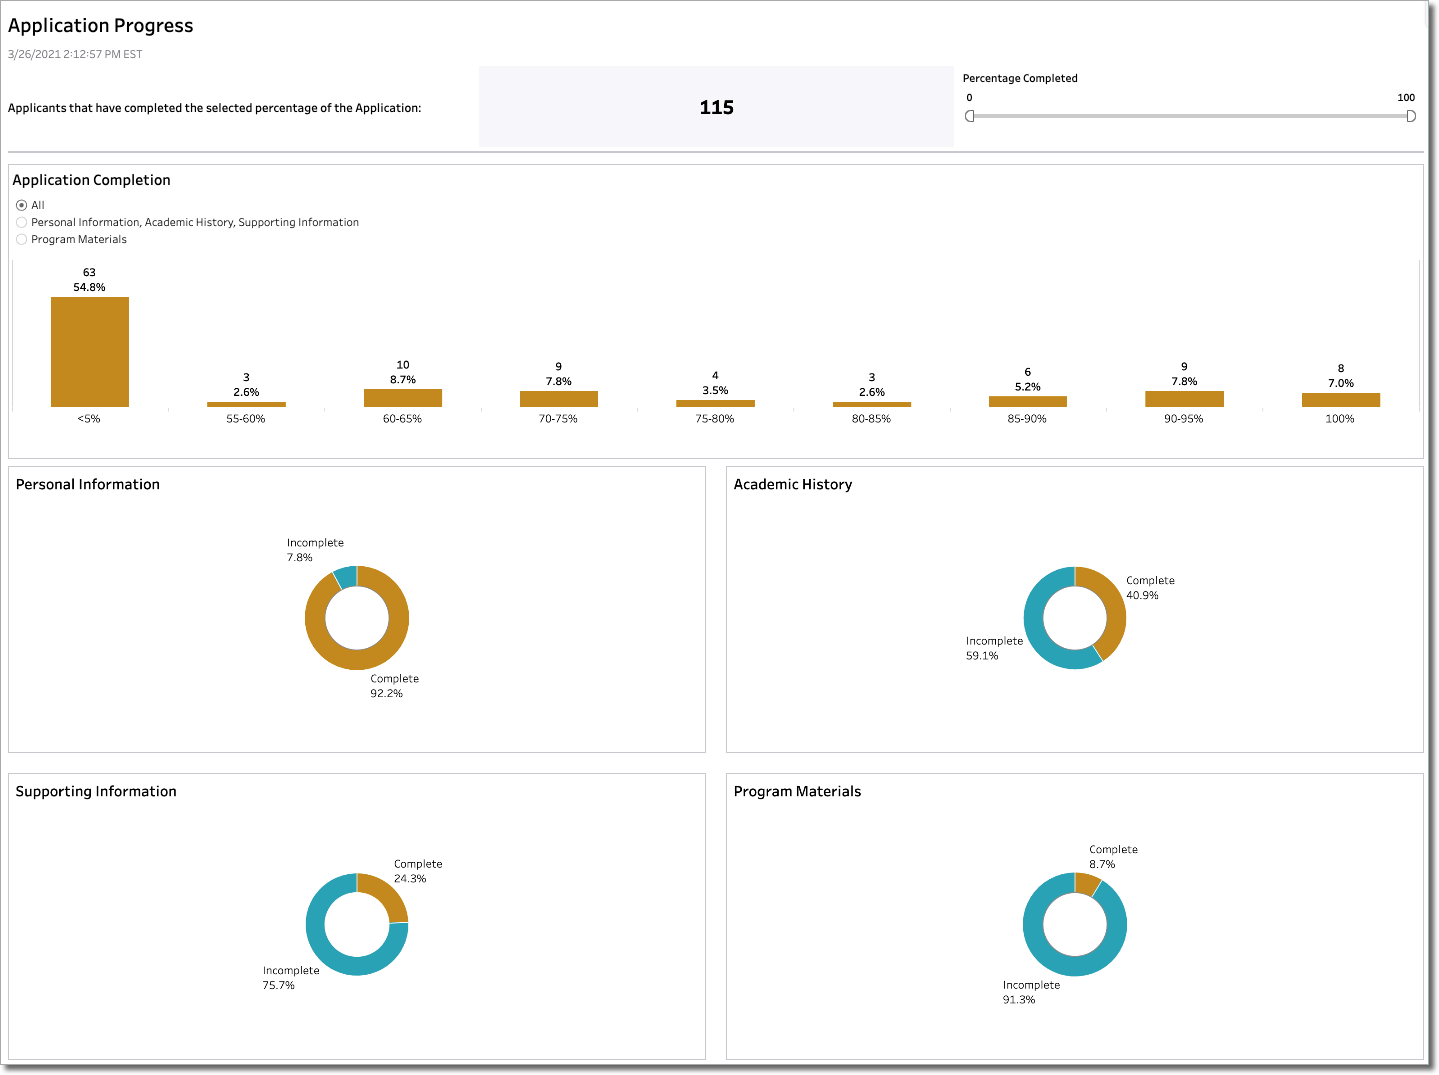
Application Progress
This dashboard provides completion metrics for in-progress applicants for each of the three core application quadrants:
- Personal Information
- Academic History
- Supporting Information
Using tooltips, you can view completion metrics for each section within each quadrant. The dashboard also includes overall completion metrics for all three combined sections.
Notes:
- The dashboard only includes in-progress applicants who have not submitted an application to an institution.
- Note: if an applicant is applying to two or more programs at the institution and submits their application to at least one of those programs, the applicant will no longer appear in this dashboard.
- The dashboard honors a CAS’s Presubmission Release Statement. If a CAS includes this release statement and an applicant chooses not to share their data before submitting their application, they will not appear in the dashboard.
- Applicants who have completed 100% of the application remain in-progress until they submit their application.
- The dashboard is refreshed several times throughout the business day with the most up-to-date information.
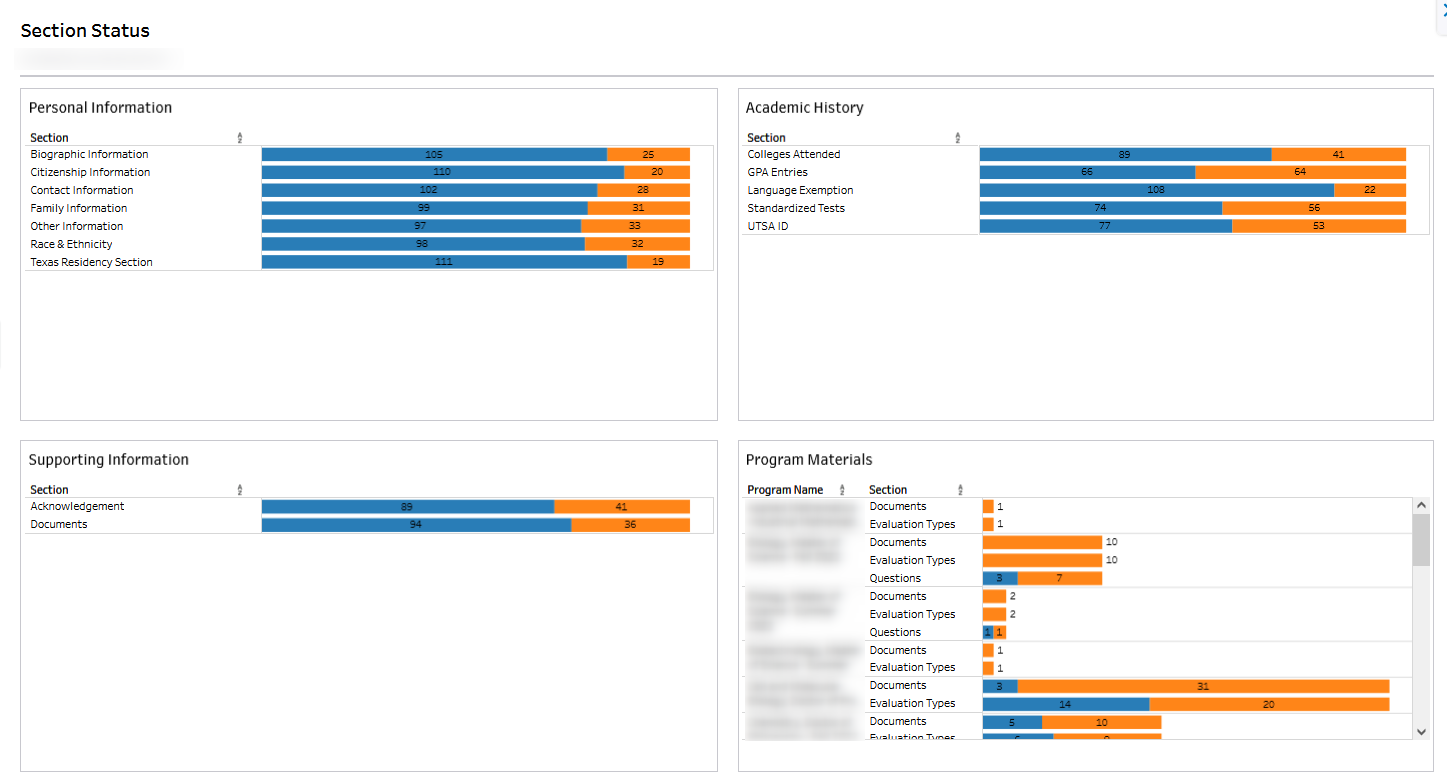
Section Status
This dashboard displays applicant progress through each of the four application quadrants, broken out by the sections that comprise each quadrant. This allows you to uncover areas of the application where applicants experience obstacles (so you can take appropriate actions).