January 20, 2020
New Features and Enhancements
The following enhancements are now available in Analytics by Liaison. If you have any questions about these features, contact support.
Volume Dashboard Update
The Submitted Applicants by Month – Running Totals and the Submitted Applicants by Week – Running Totals dashboards now display running totals for each month/week in the cycle, starting with the date the first application is submitted to the date the last application is submitted. Previously, these dashboards displayed the running totals only for the months where an application was submitted.
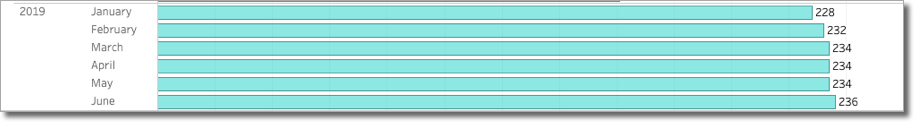
In the example above, the organization received the following submissions:
- 228 submissions in January (January displays 228)
- 4 submissions in February (February displays 232)
- 2 submissions in March (March displays 234)
- 0 submissions in April and May (both April and May display 234)
- 2 submissions in June (June displays 236)
Note: If the last application submission to an organization is prior to the month the cycle ends, the last month to display on a dashboard is the month of the final submission.