Academic History Dashboards
Overview
Academic History Dashboards provide a visual representation of applicants' academic history-related information.
Notes:
- Not all CASs collect the same standardized test information. The following help content may include standardized tests that do not apply to your CAS.
- If an applicant attempted a test multiple times, those attempts are all reflected in the dashboard.
- Some dashboards include a filter for Official Status or Is Official; these filters allow you to segment the data by official or unofficial test scores. If a dashboard does not include either filter, the test scores that appear are official test scores.
Working with and Downloading Data
As you review the following dashboards, refer to the Working with Dashboard Data page for specific information on:
- Using filters to narrow your data.
- Viewing tooltips to better understand your data.
- Viewing and downloading the raw data so you can work with it outside of Liaison Analytics.
Colleges Attended
Using this dashboard, you can identify your top domestic and international feeder schools.
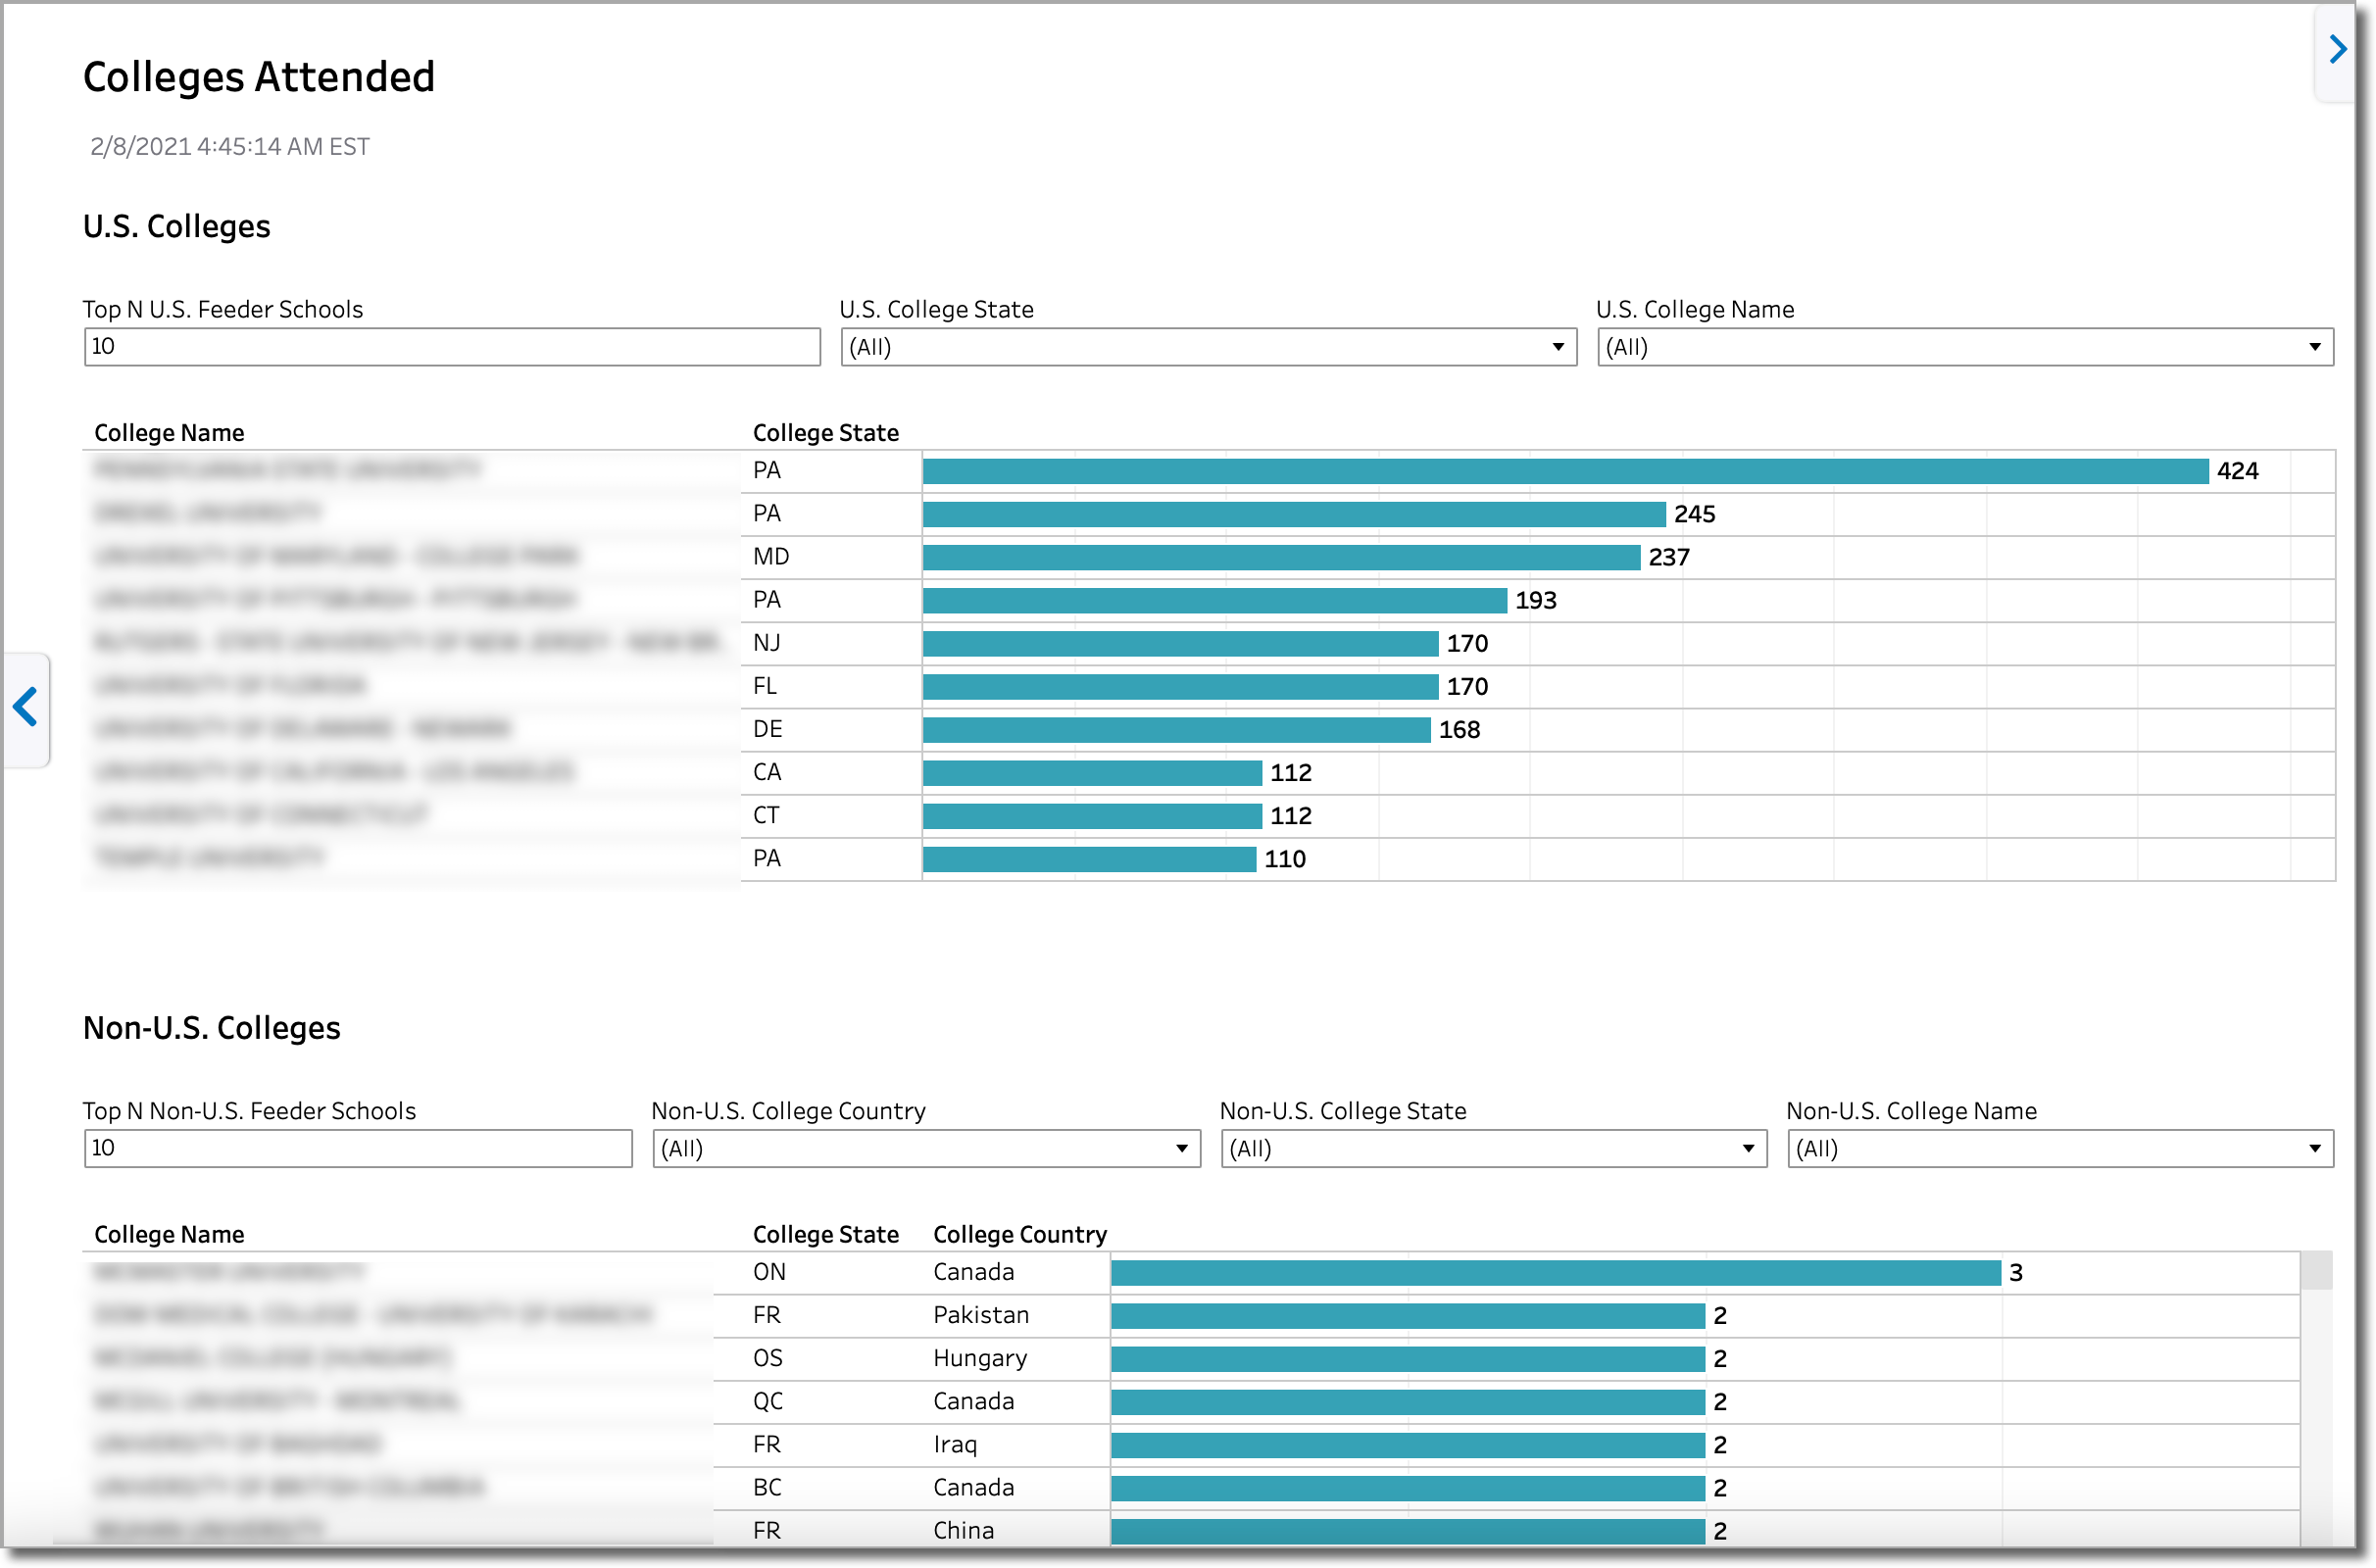
Notes:
- Applicants who attended more than one college are counted once for every college they attended. To pinpoint primary colleges attended, use the Primary College filter.
Applicants by High School Attended
Using this dashboard, you can identify the top high schools your applicants graduated from.
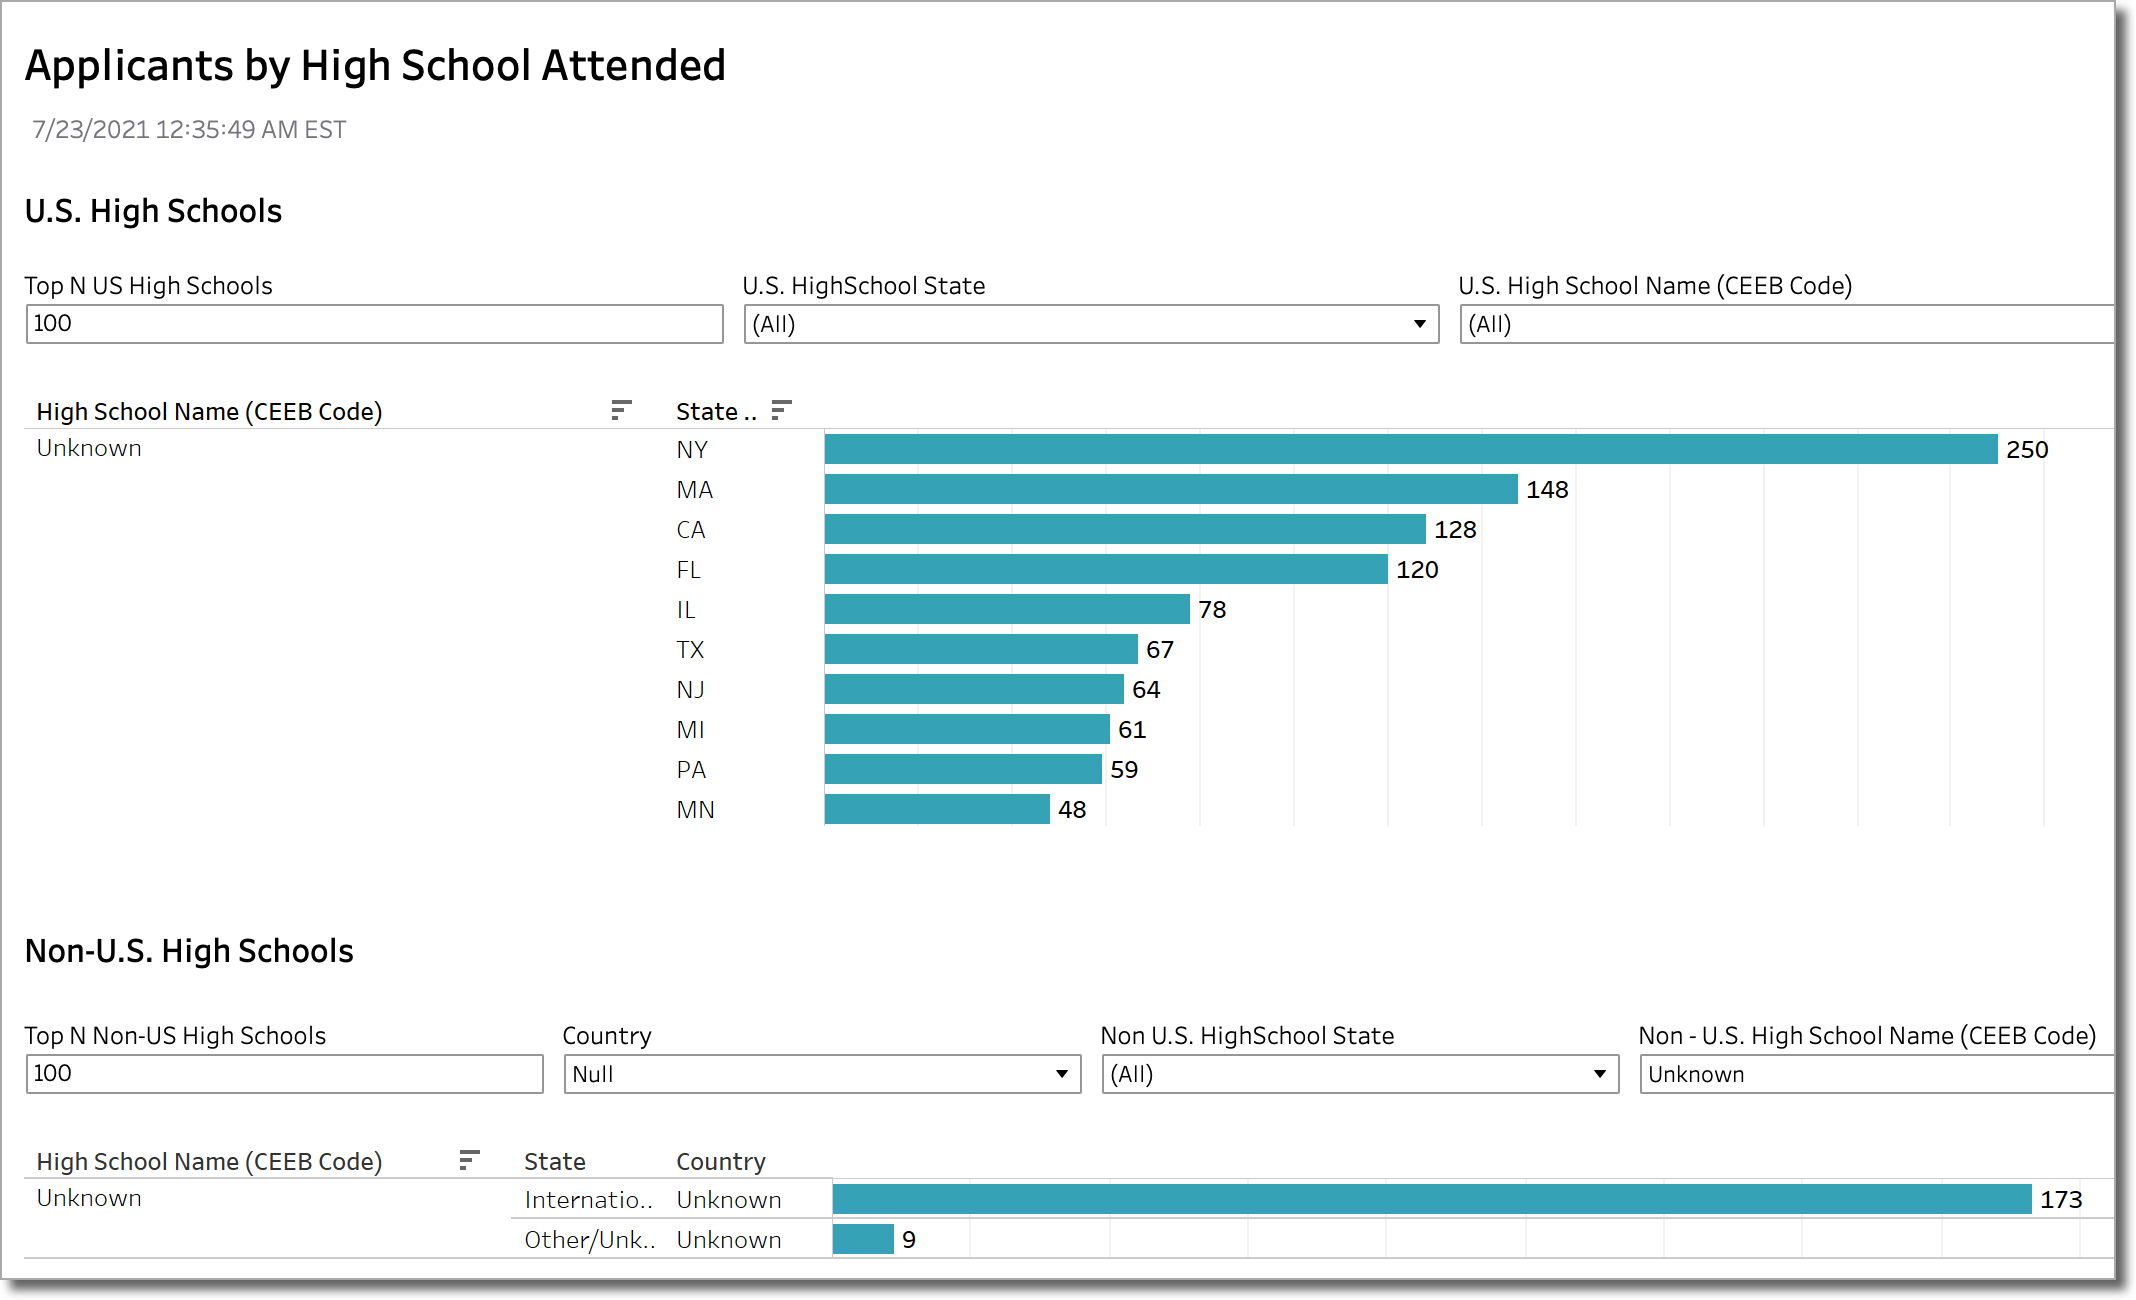
Note: this dashboard only includes applicants who indicated in the application that they graduated from high school. Applicants who have not graduated are not included.
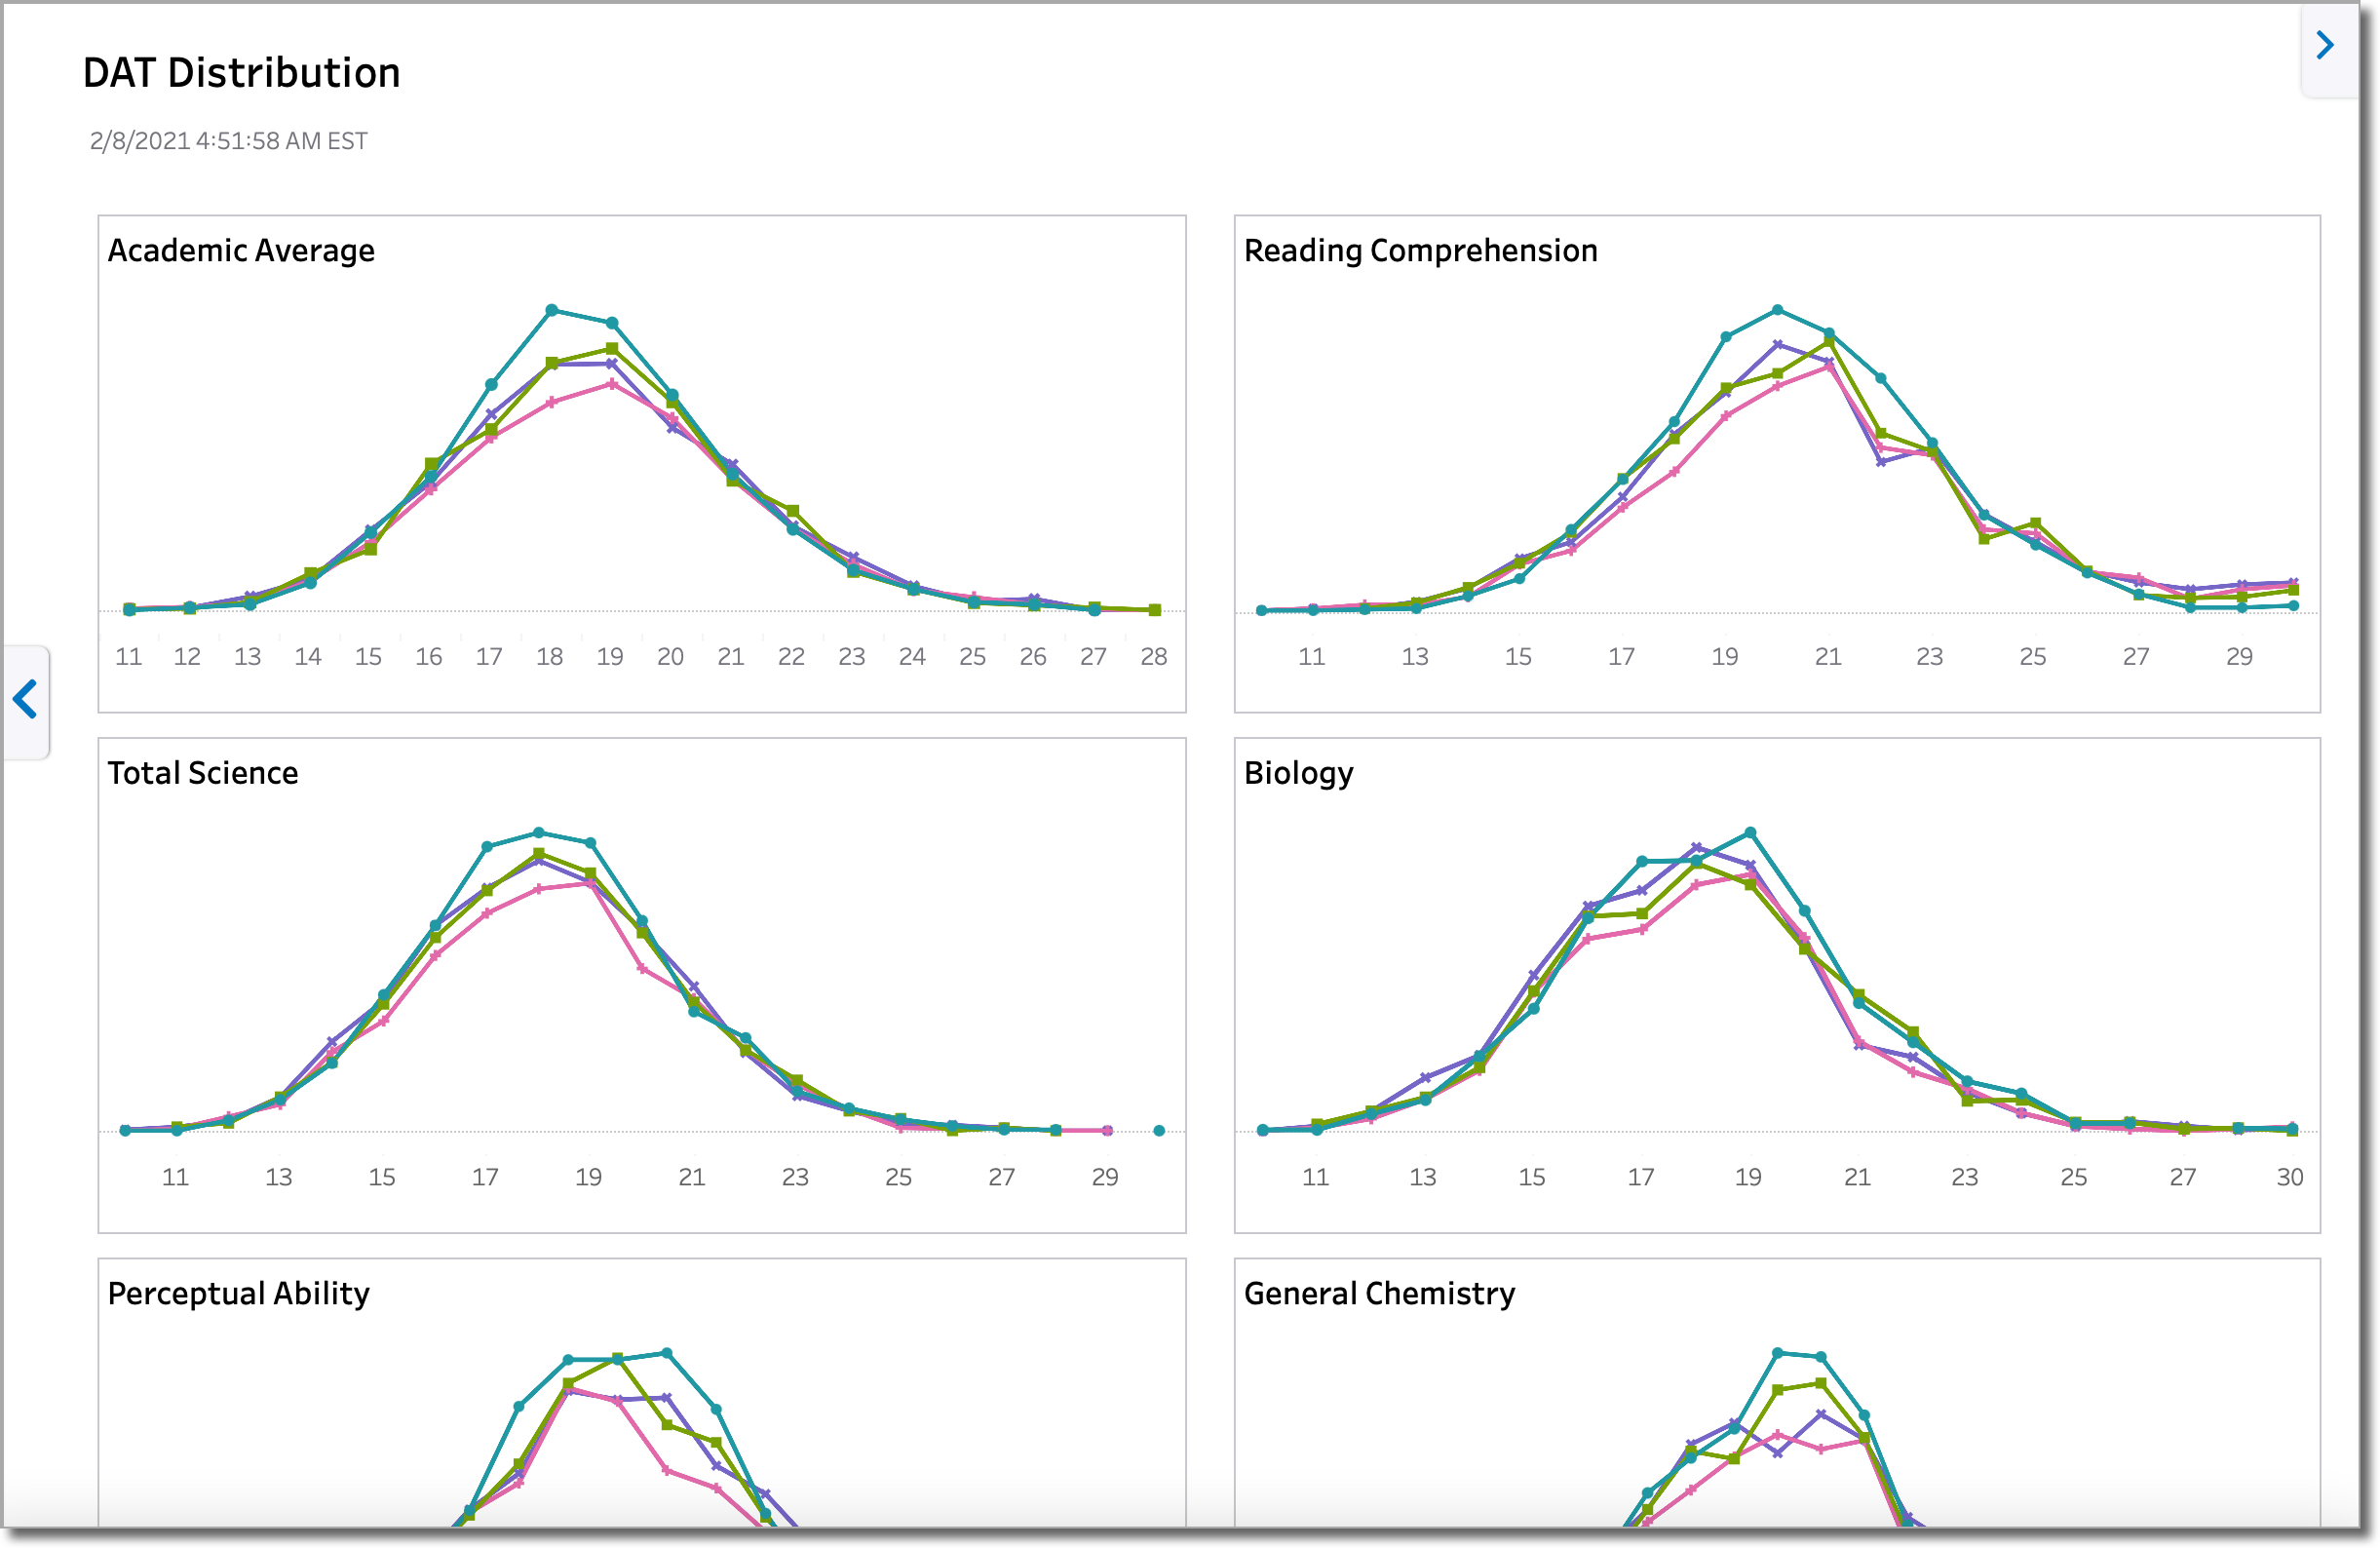
DAT Distribution
This dashboard provides a breakdown of DAT scores.
GRE Distribution
This dashboard provides a breakdown of GRE scores.
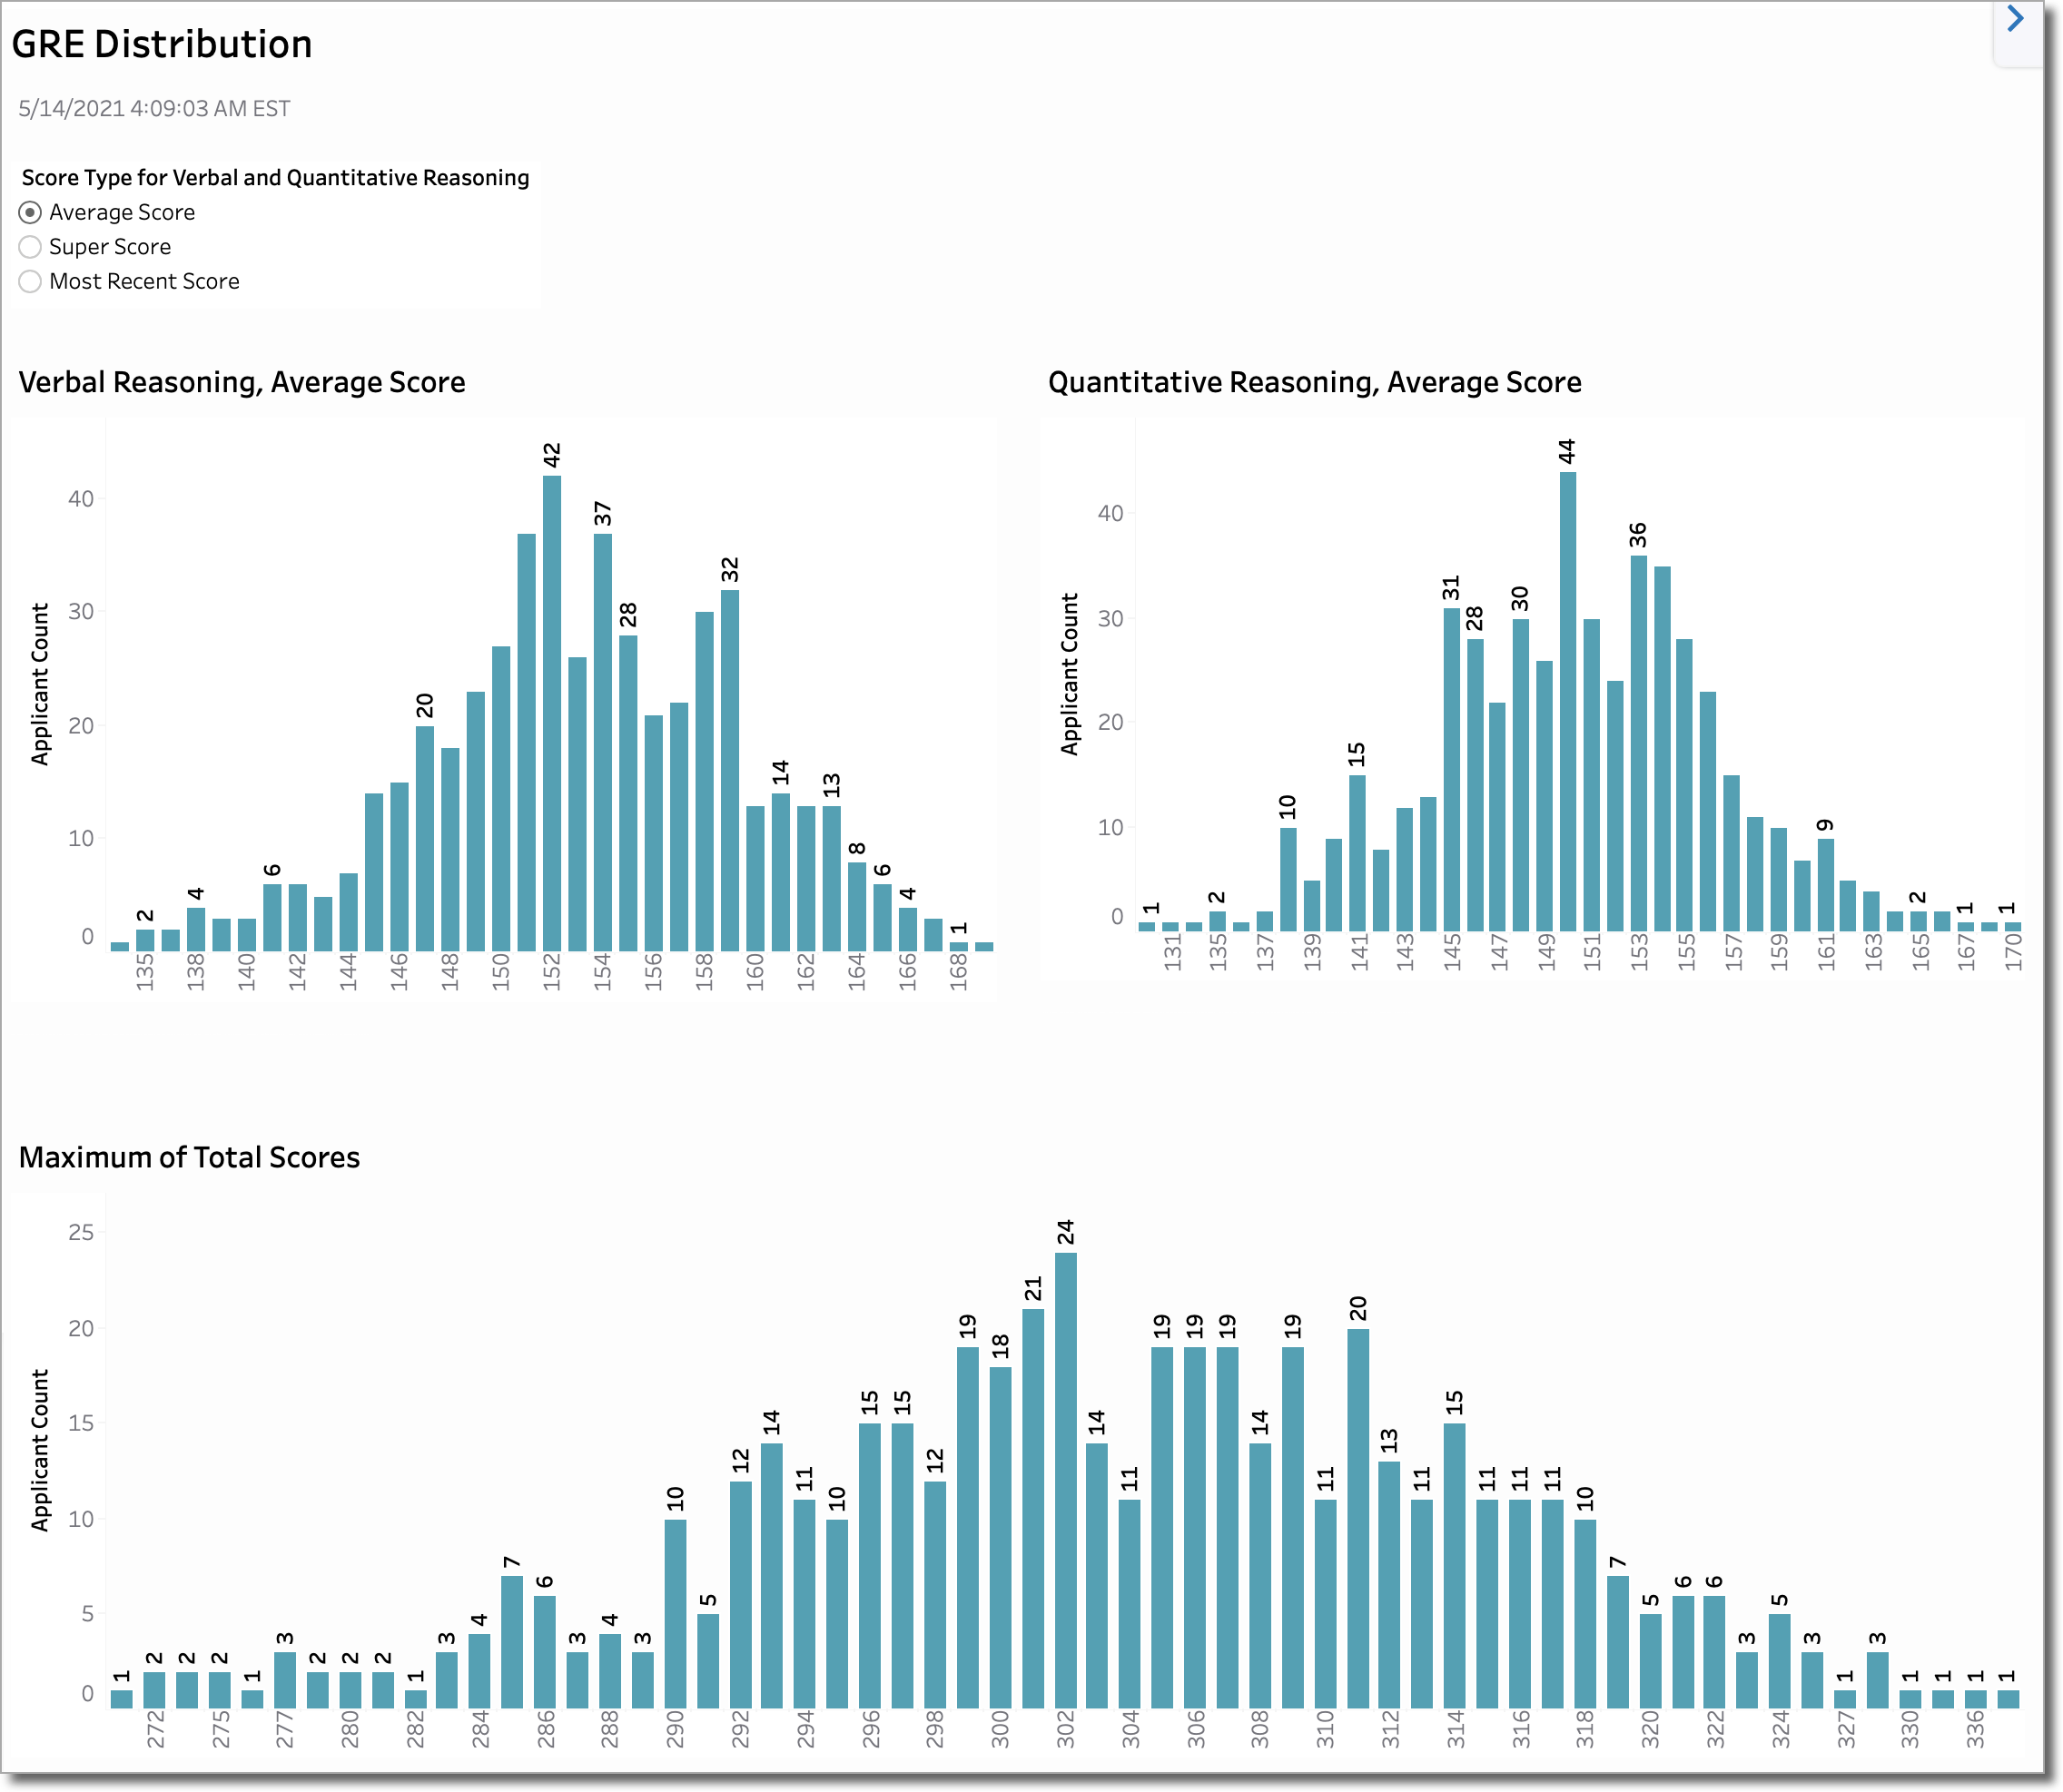
Notes:
You can use the Score Type for Verbal and Quantitative Reasoning filter to change the way multiple test attempts are displayed.
- Average: for each section of the test, the dashboard displays the average of all the applicant’s reported scores for that section. For example, if an applicant took the test twice and scored V-152 on the first attempt and V-156 on the second, that applicant’s verbal score is reflected as 154.
- Super Score: for each section of the test, the dashboard displays the highest score the applicant achieved in that section, regardless of which attempt it was made in. For example, if an applicant took the test twice and scored V-151/Q-162 on the first attempt and V-158/Q-155 on the second, the dashboard reflects 158 for the applicant's verbal score and 162 for the applicant's quantitative score.
- Most Recent: the dashboard reflects the applicant's most recent scores, ignoring any previous attempts.
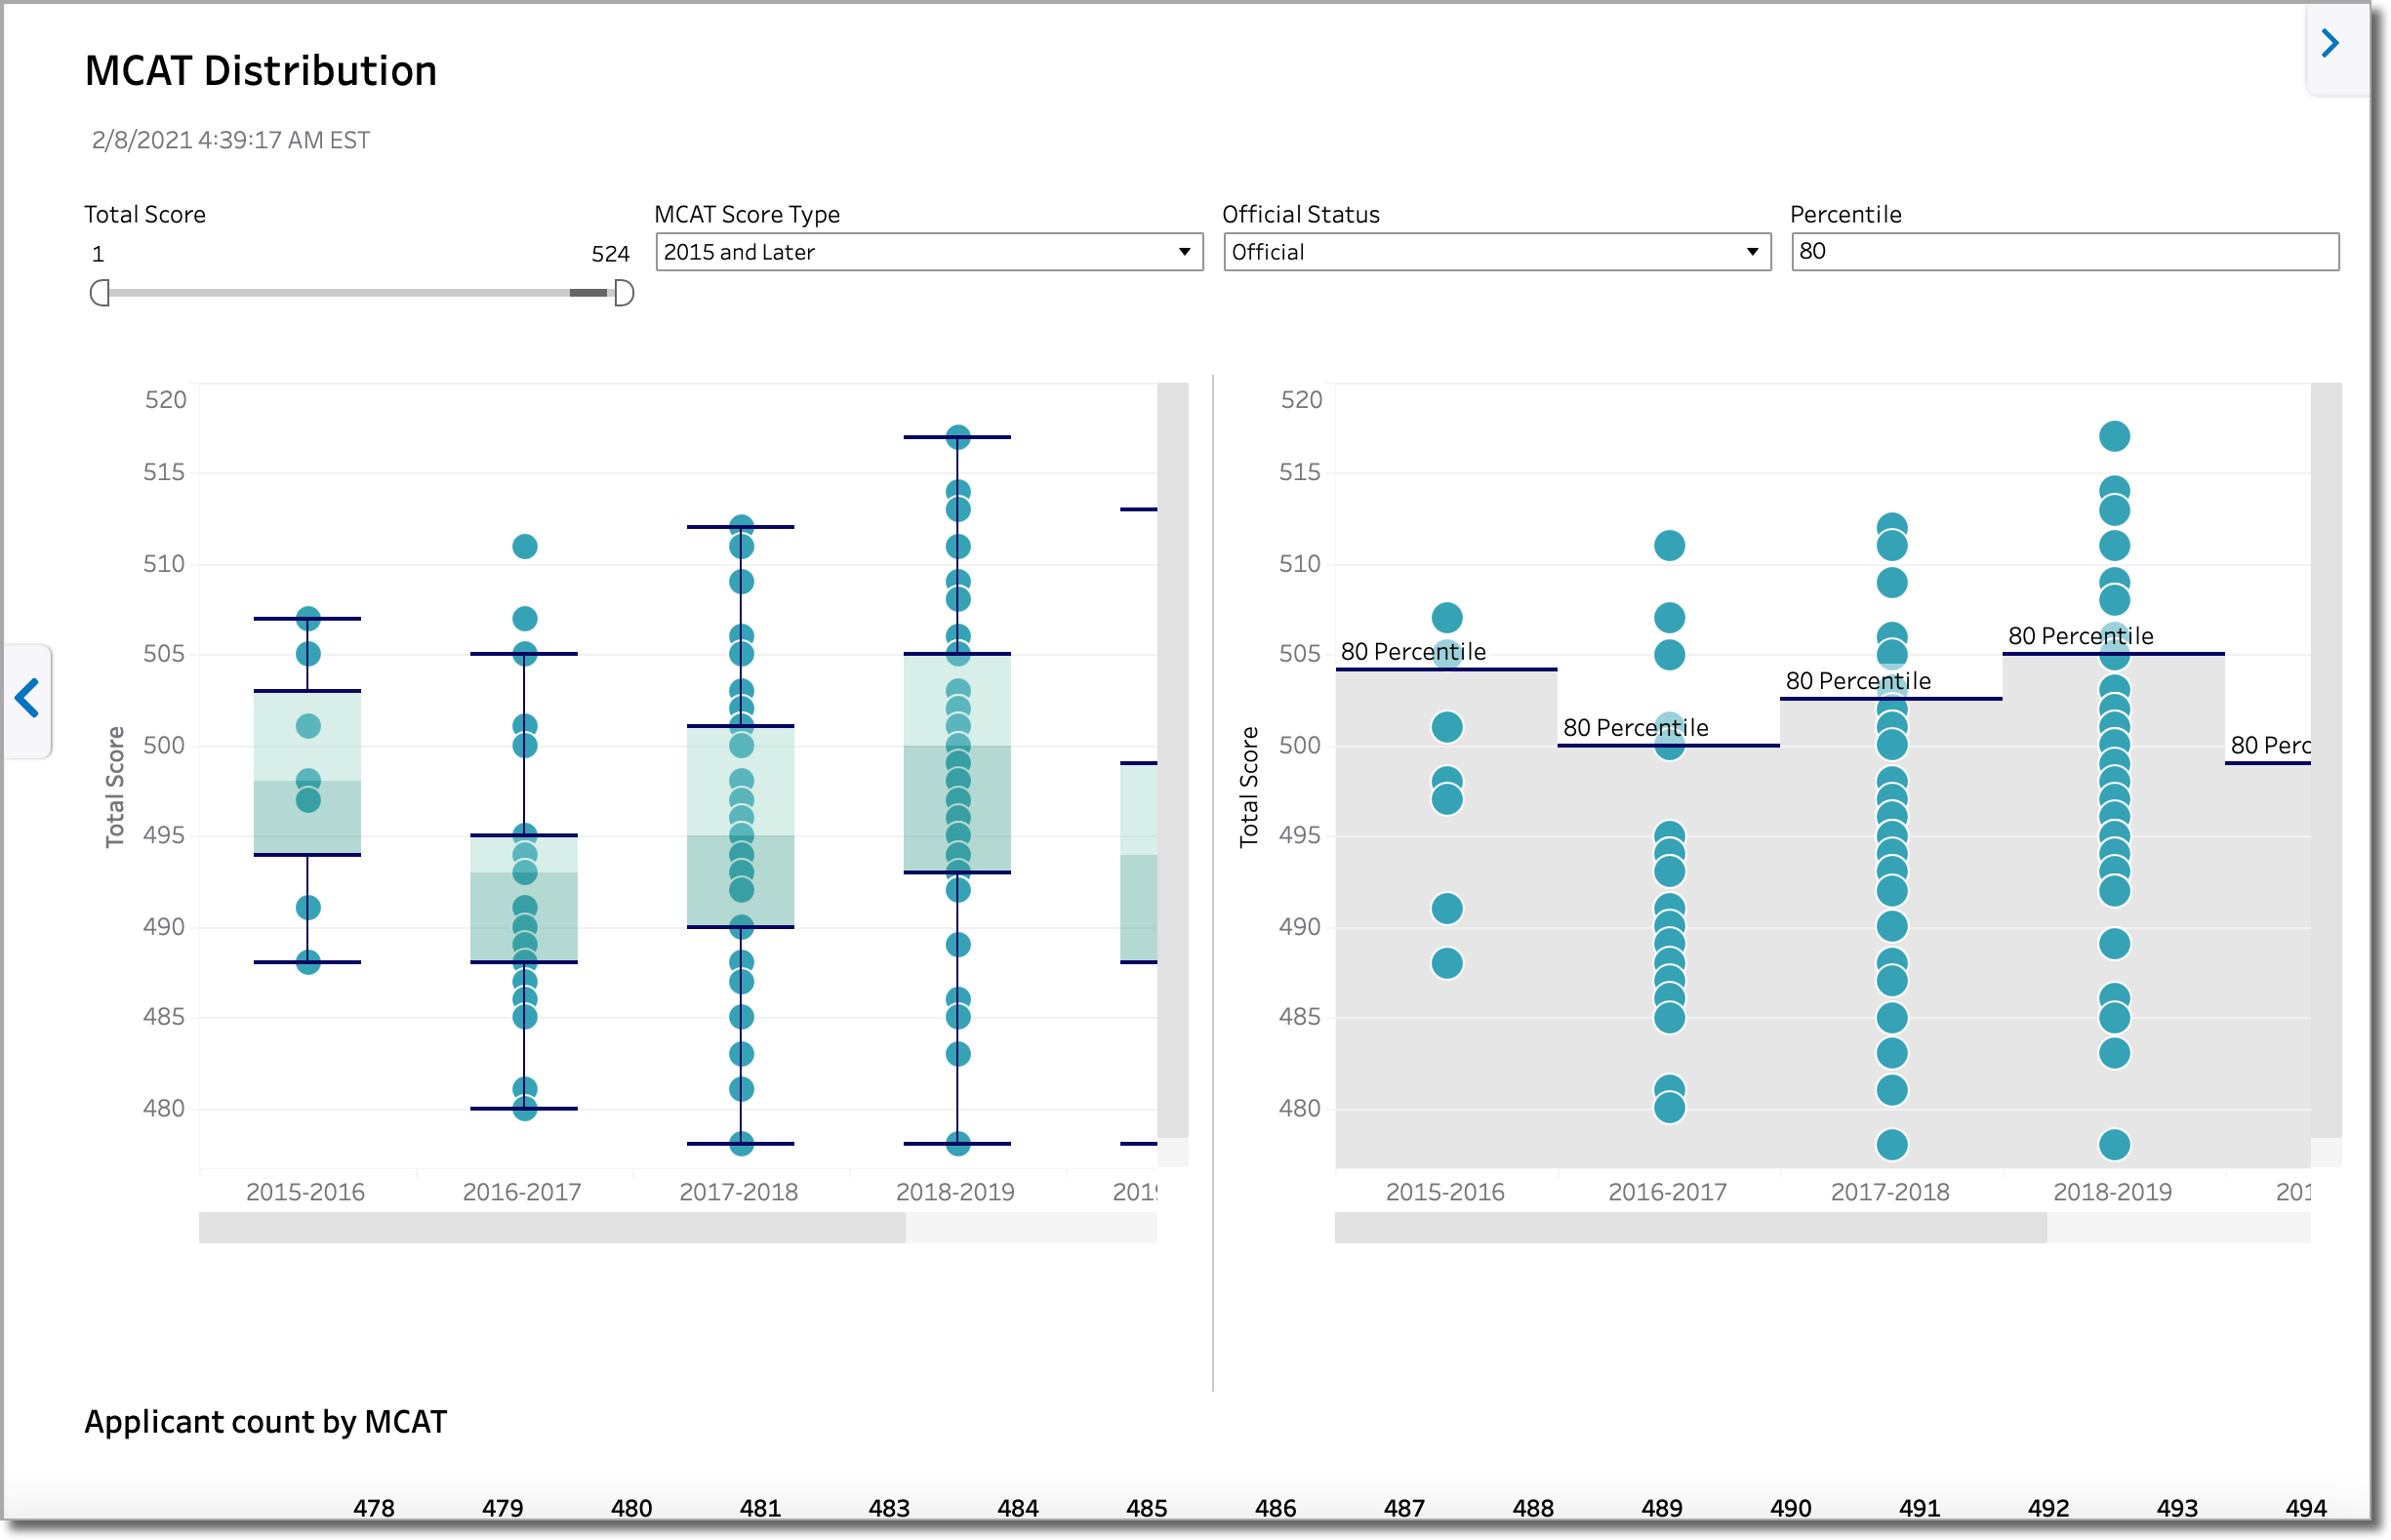
MCAT Distribution
This dashboard provides a breakdown of MCAT scores.
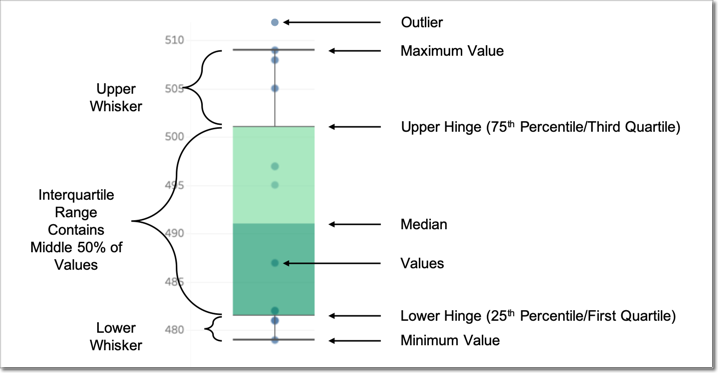
Understanding the Boxplot
The dashboard uses box-and-whisker plots, or boxplots, to show distributions of data. The name refers to the two parts of the plot:
- The box, which contains the median of the data (median is the number that is at the midpoint of an ordered data set) along with the first and third quartiles (25% less than and 25% greater than the median).
- The whiskers, which typically represents data within 1.5 times the interquartile range (the difference between the first and third quartiles).
MCAT Filters
The dashboard includes a Percentile filter, as well as three additional MCAT filters:
- Test Score slider: allows you to filter by a test score range by either adjusting the slider or typing the start and/or end score for the desired range.
- MCAT Score Type: allows you to filter by test scores submitted before 2015 or 2015 and later (based on MCAT changing the test format to include a different number of subjects and test score scales).
- Old MCAT Scaled Score: a number between 3–45, with a 50th percentile score of approximately 25. Includes scores such as BiologicalSciences, PhysicalSciences, and VerbalReasoning.
- New MCAT Scaled Score: a number between 472–528, with a 50th percentile score that hovers around 500. Includes scores such as CPBScore, CARSScore, and BBFLScore.
- Official status: allows you to filter by official or unofficial test scores. Official scores are test scores sent to the CAS directly from the administrator of the test (AAMC, ETS, ADA, etc.). Unofficial test scores are reported by applicants in the application.
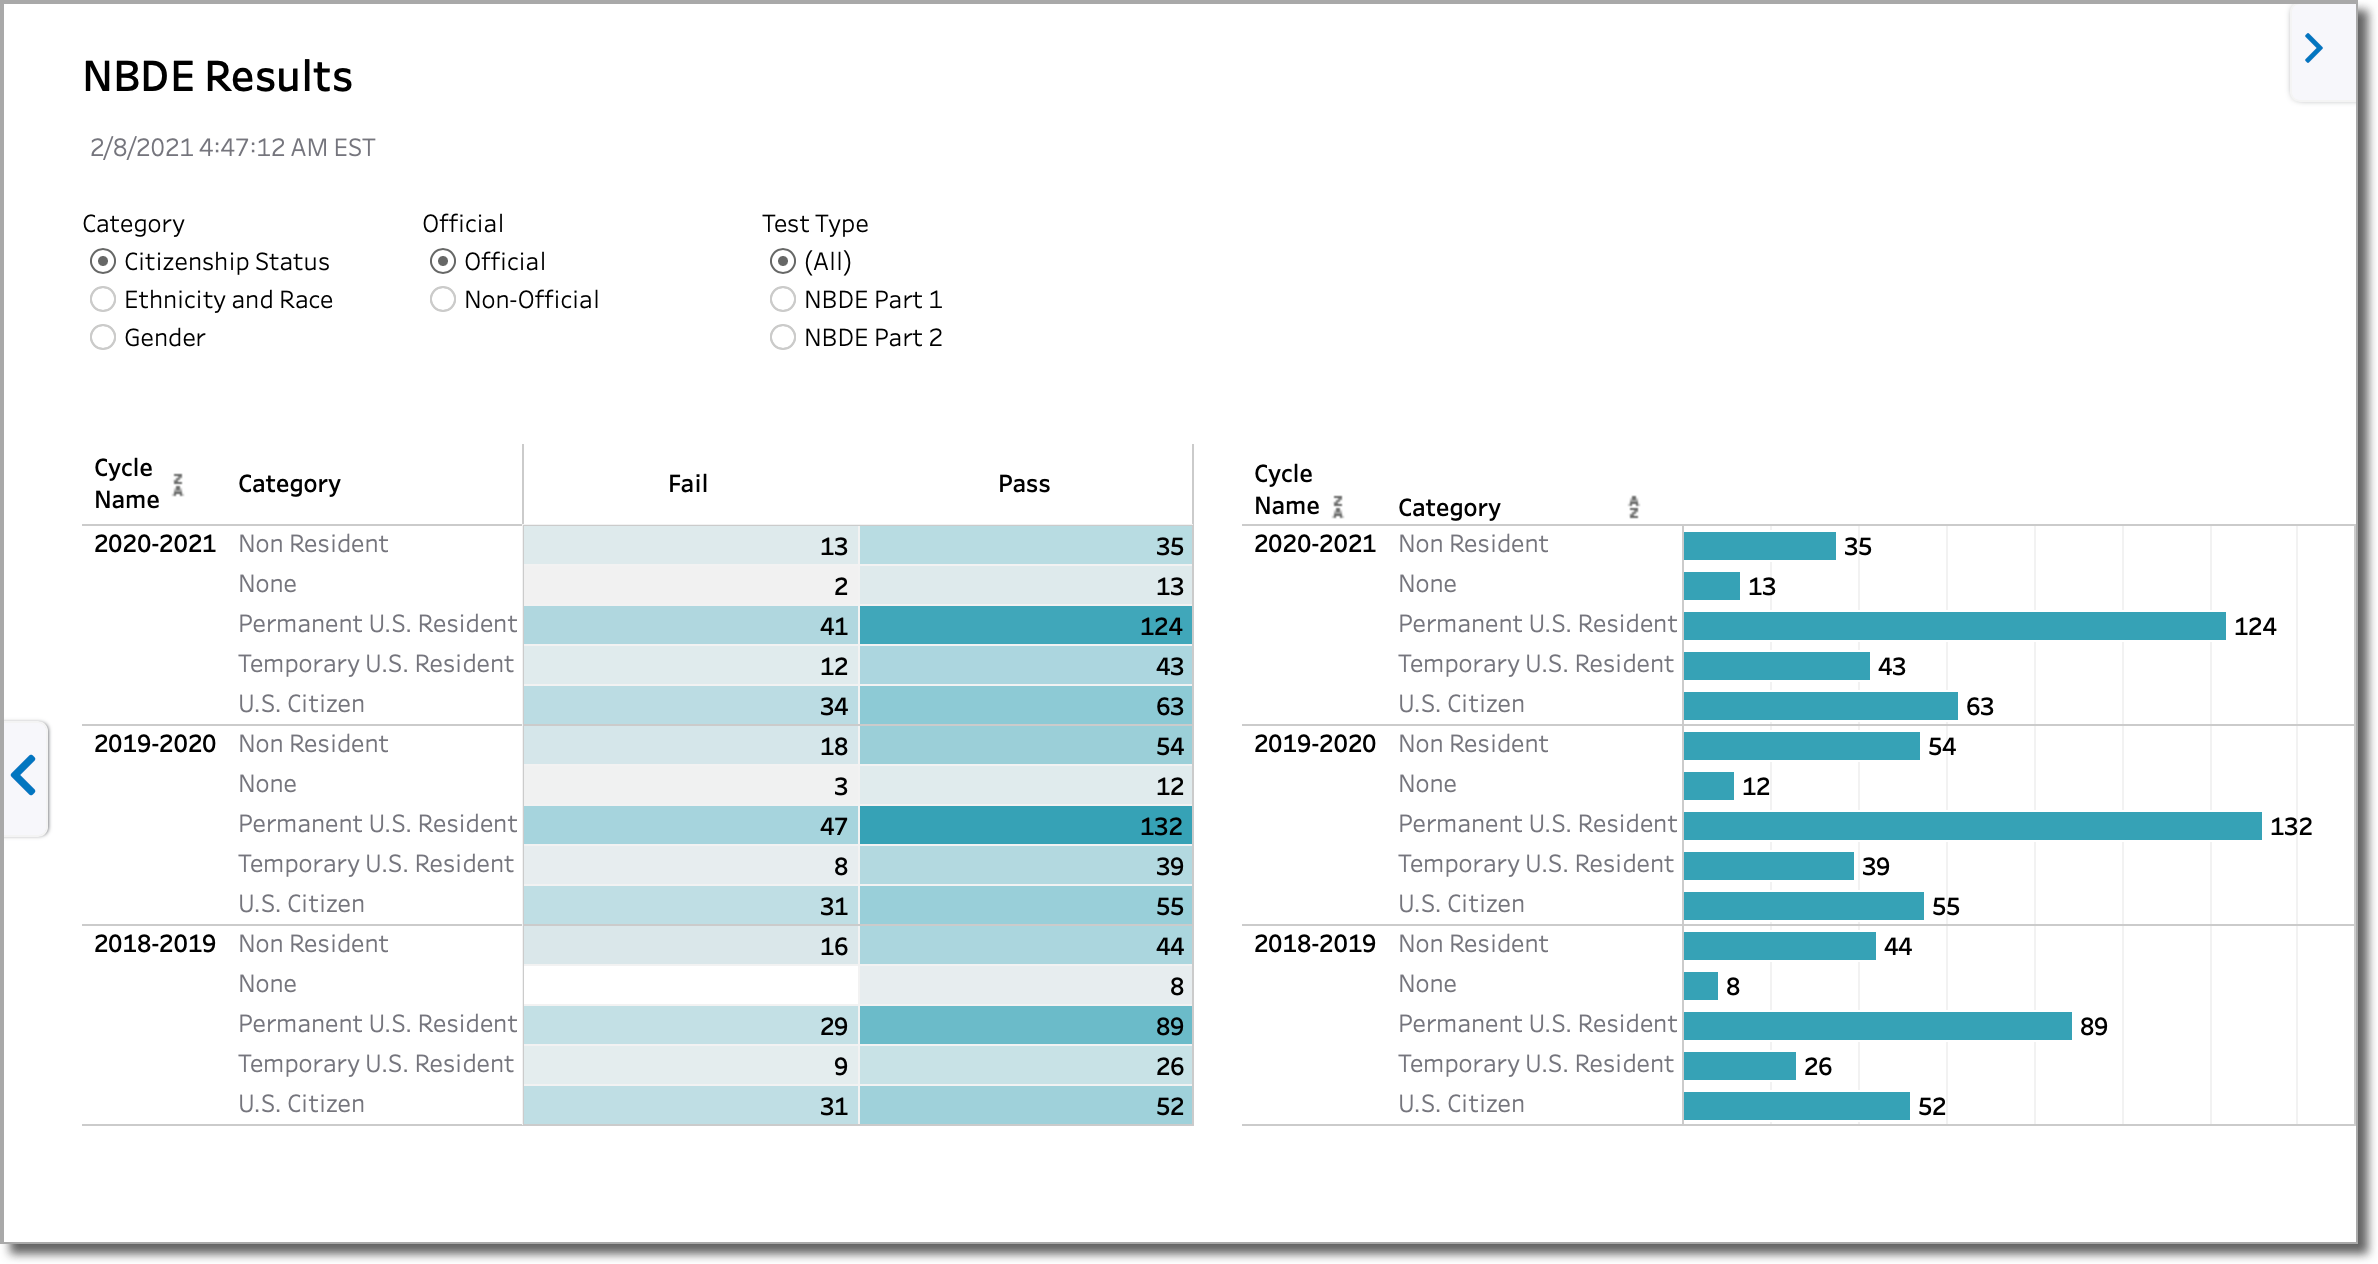
NBDE Results
This dashboard provides a breakdown of NBDE results.
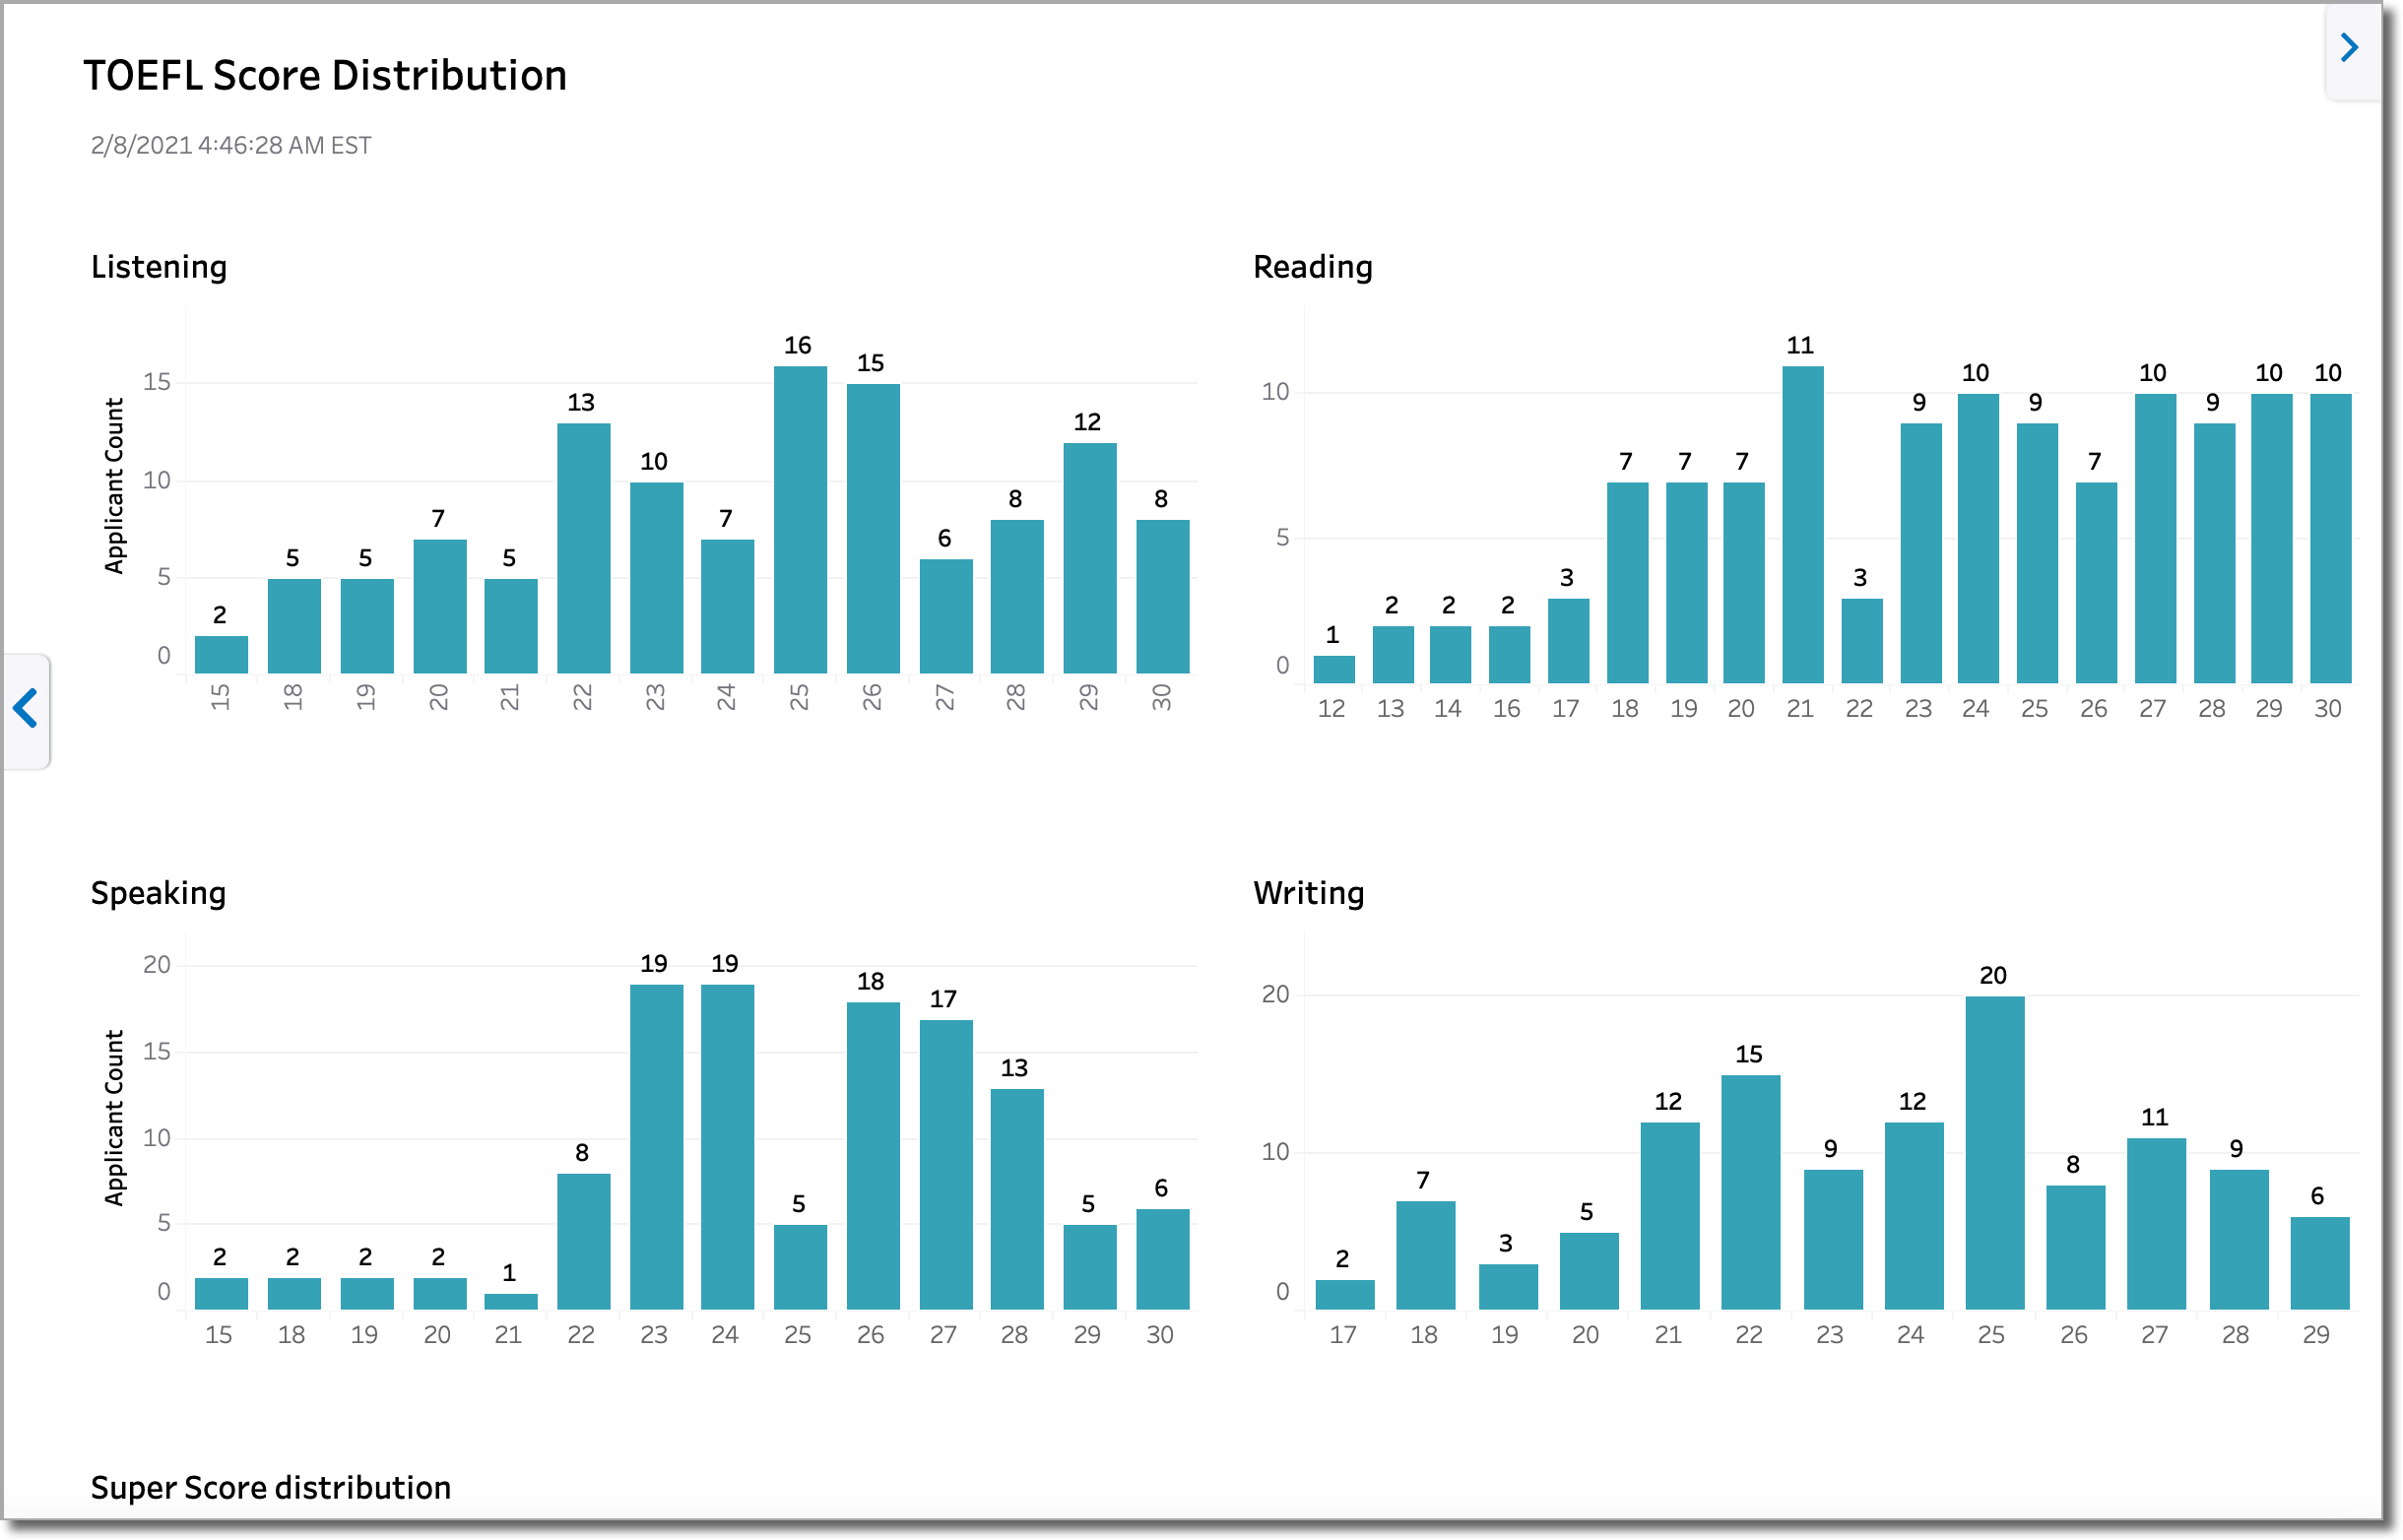
TOEFL Score Distribution
This dashboard provides a breakdown of TOEFL scores.