Navigating the Dashboard
Overview
After logging in to your CSU Transfer Planner account, you land on the Dashboard, which includes an overview of your student pool, their statuses, and access to CSU Transfer Planner's various tools. You'll be given access to the default dashboard.
Navigating the Dashboard
There are four main areas of the Dashboard:

- Navigation Menu: access the available features in CSU Transfer Planner. You can expand and collapse the Navigation Menu by clicking the top icon.
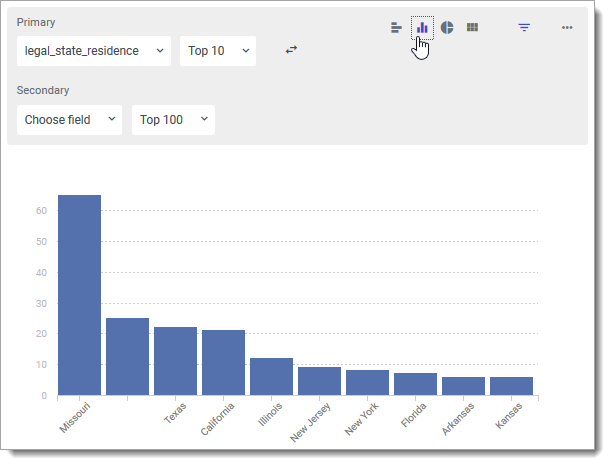
- Dashboard: quickly view charts about your student pool.
- Pencil icon: add, edit, and rearrange the charts on your Dashboard.
- Settings Menu, Help Menu, and My Account Menu: manage users and Roles, access the Configuration Portal, access the CSU Transfer Planner Help Center, and update your account profile (respectively).
Customizing the Dashboard
If your permissions allow for it, you can adjust what appears on your Dashboard. To do this:
- Navigate to your Dashboard and click the Edit pencil.

- From here, you can add new charts or adjust any of the existing charts that appear on your dashboard. If you create a new chart using this method, the chart will be deleted if you revert your changes (see step 5). Changes you can make to existing charts include:
- Adjusting the data that is displayed in a chart by clicking the drop-down menus.

- Adjusting the style of the chart by clicking the appropriate chart icon.
- Adding new filters by clicking the filter icon, then the Add Filter link.

- Deleting or duplicating charts by clicking the More Options button and selecting the appropriate option.

- Adjusting the data that is displayed in a chart by clicking the drop-down menus.
- To reorder how the charts appear on your dashboard:
- Click Rearrange.
- Click the top left corner of any chart or group to rearrange it.
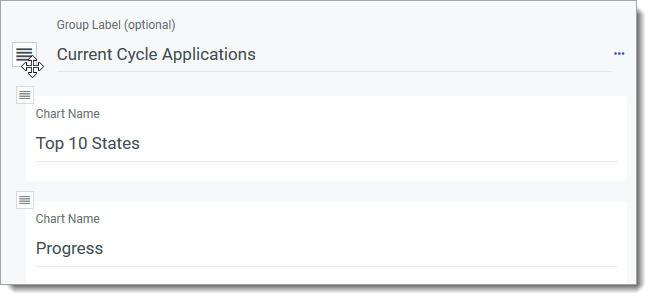
- When you're done adjusting the arrangement, click Done Rearranging.

- Click Rearrange.
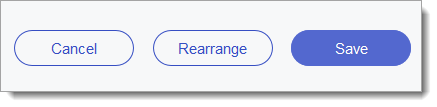
- To cancel the edits you've made, click Cancel. To keep them, click Save.
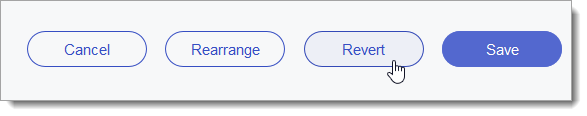
- After saving adjustments, you can undo them by clicking Revert. This deletes any changes or new charts you created through the Dashboard edit.
If you personalize your Dashboard, it becomes your own customized version of the Dashboard.