Recommendations and Simulating Decisions
Recommendations
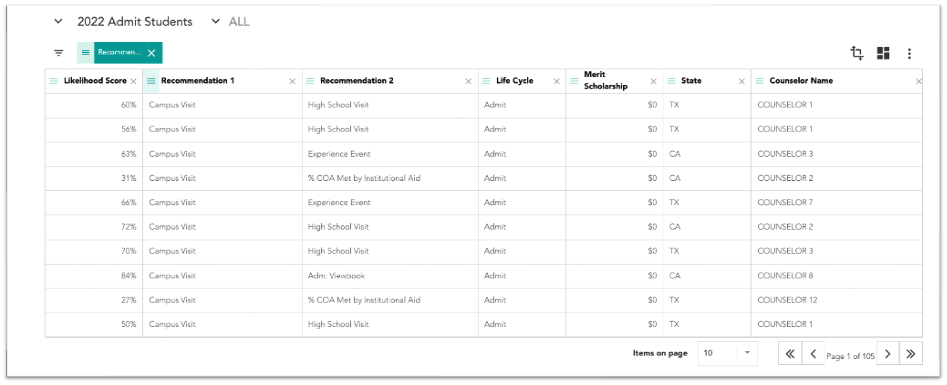
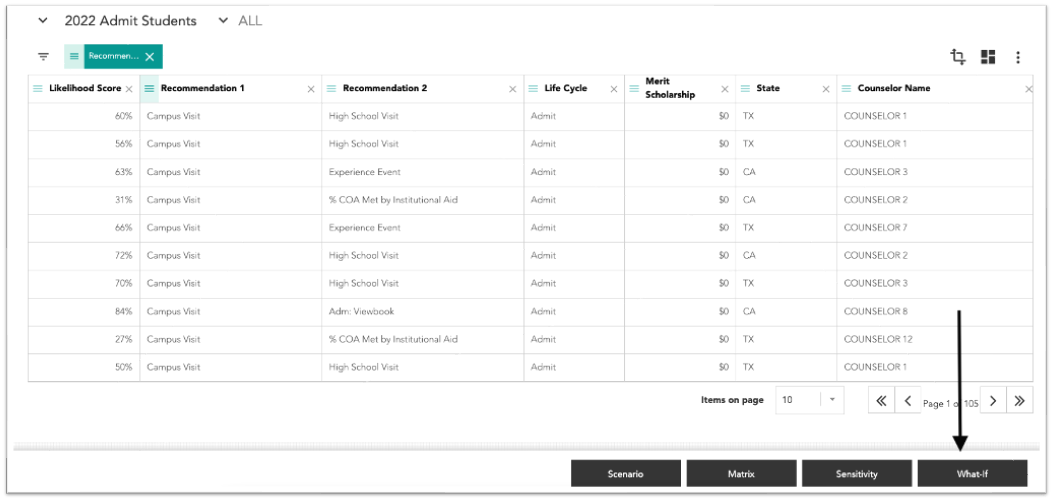
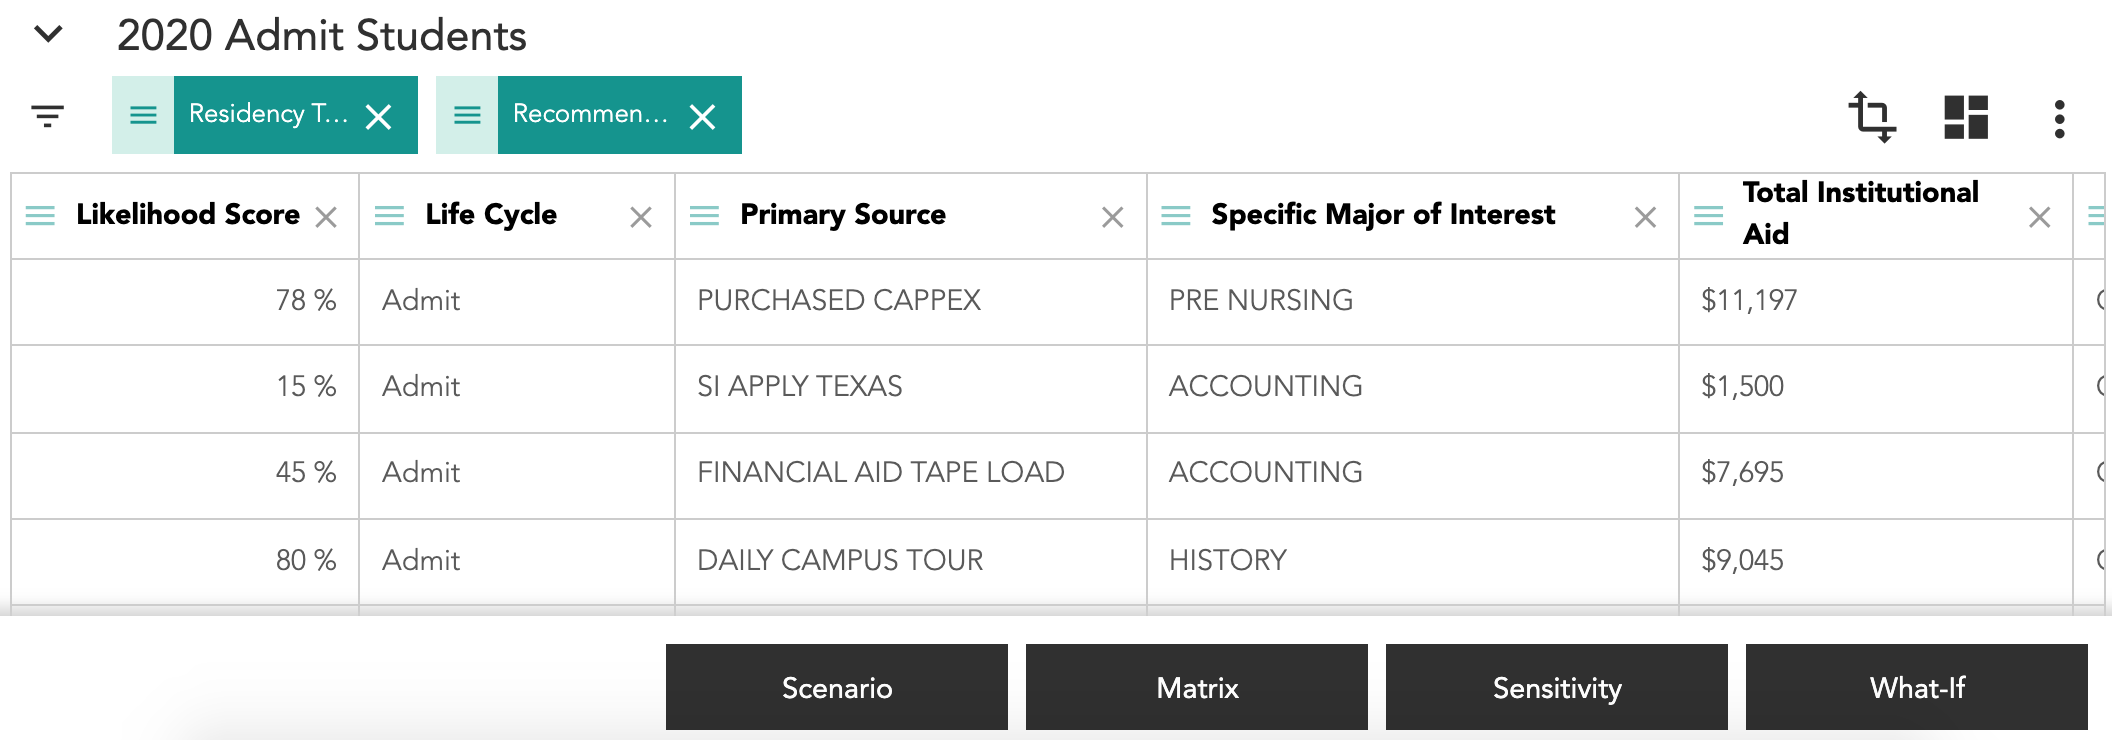
Each student has a Likelihood Score that estimates the probability they will ultimately enroll or be retained. Institutions may have events, actions, or programs designed to influence a student’s decision to enroll over another institution. The Recommendation 1 column in the grid view displays the single most significant event, action, or program impacting a student’s likelihood score, while the Recommendation 2 column displays the second most significant event, action, or program. The values in the recommendations columns utilize Othot's prescriptive analytics capabilities at the individual level.
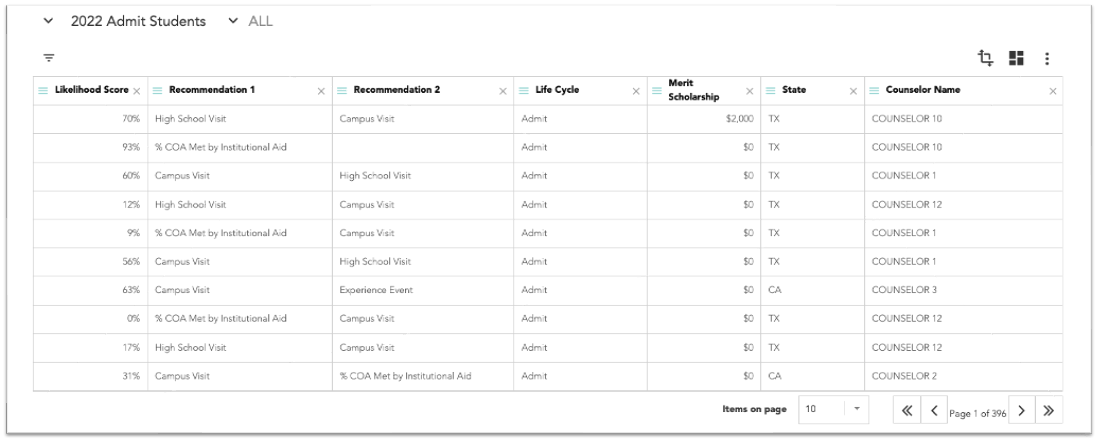
The Recommendation 1 column is useful for segmenting students for specific events, programs, campaigns or additional financial aid offers. Applying a filter to the column with a selected action displays the students that would be most influenced by the selected recommendation.
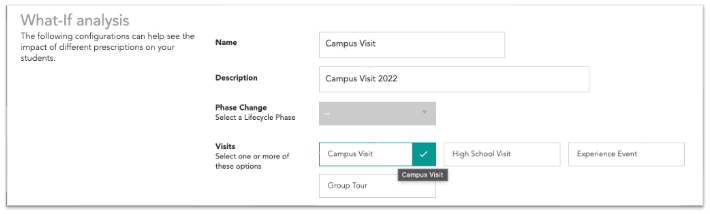
Creating a What-If Analysis
A What-If analysis allows you to better allocate your financial or operational resources by helping you understand which actions are most impactful to meet your goals.
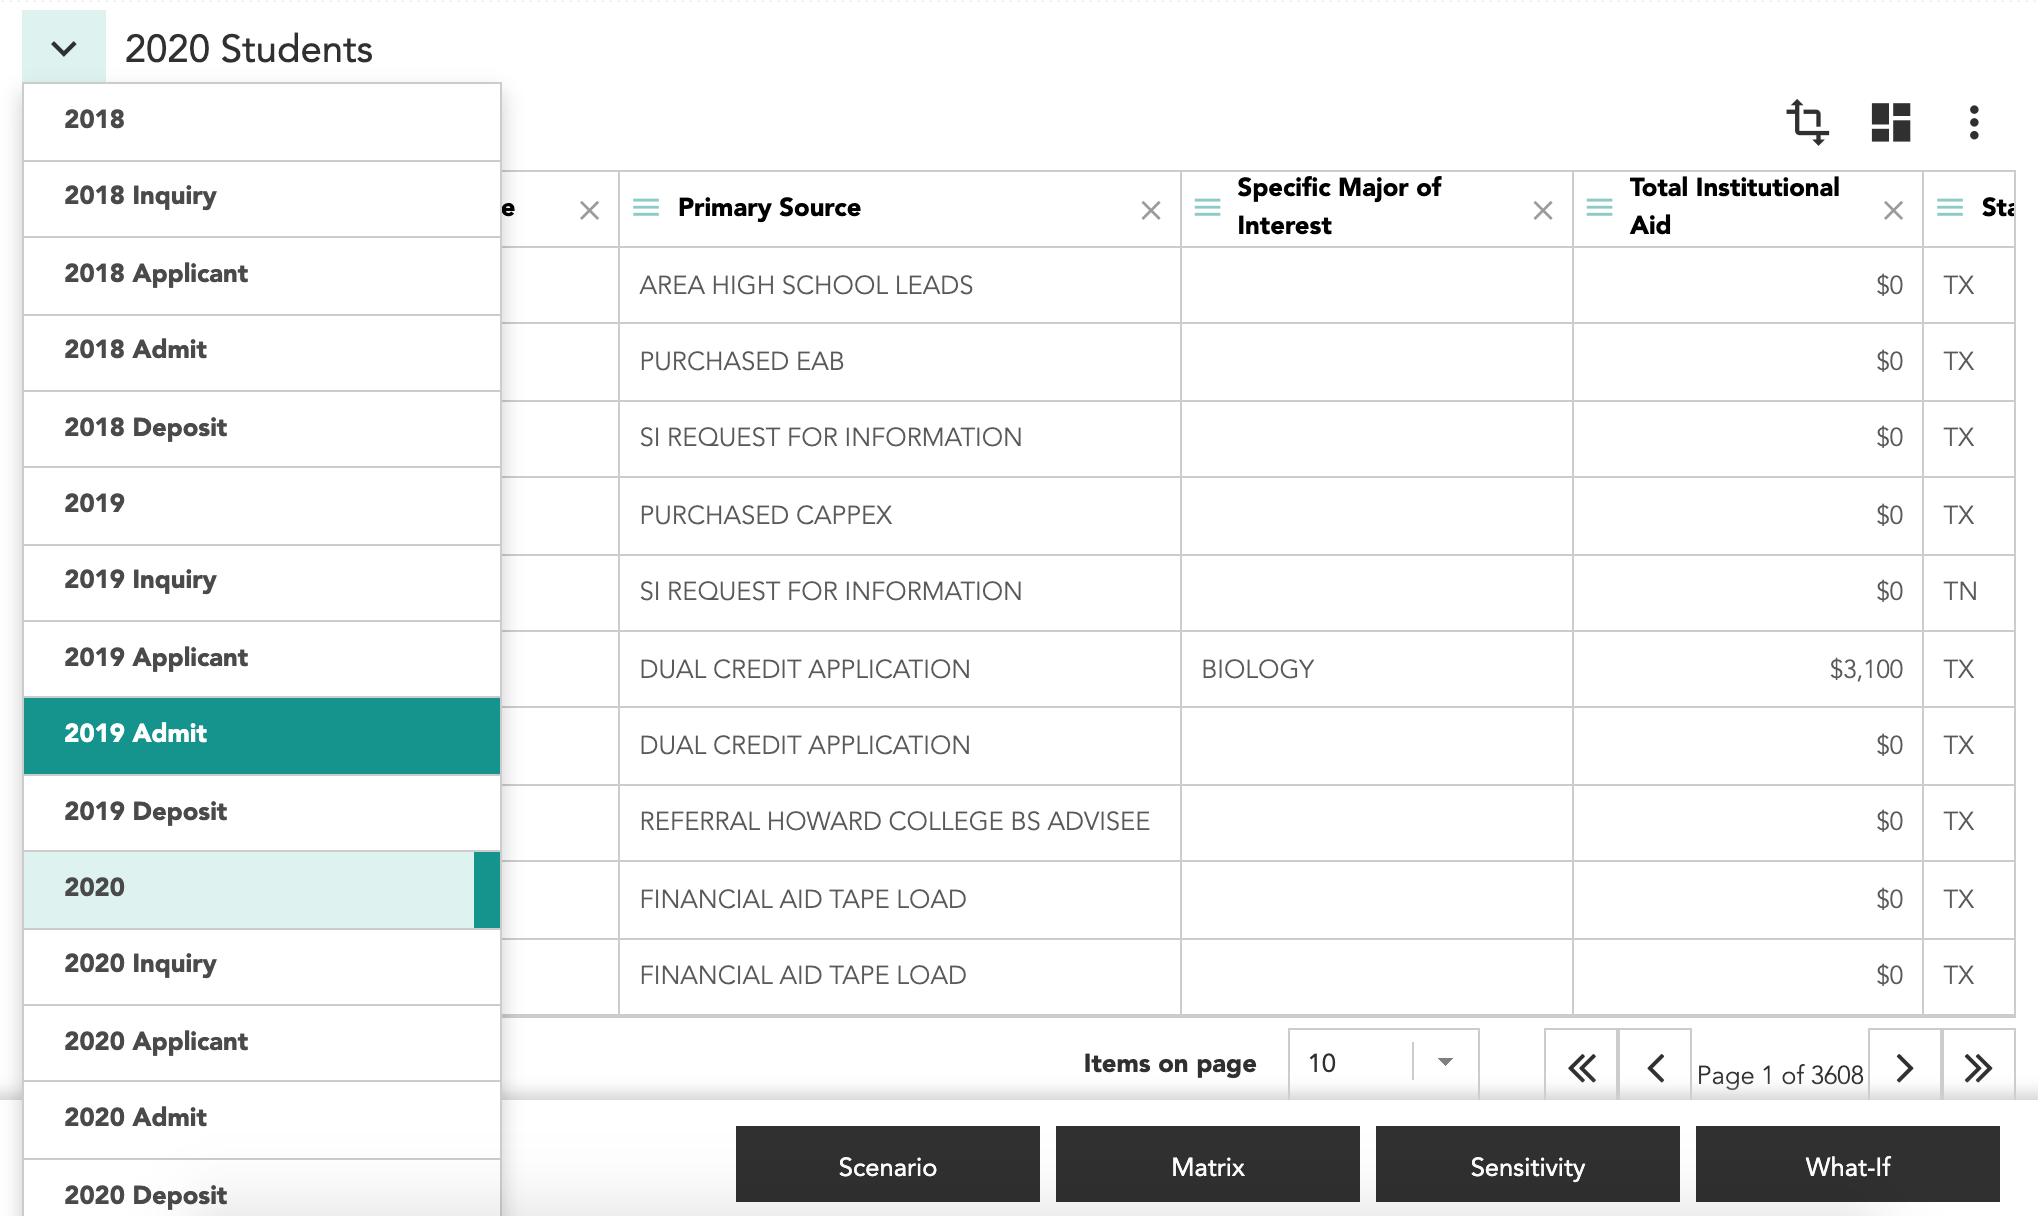
- Navigate to the Analyze tab in the Insights section.
- Configure the grid view by adding columns, applying filters, or by applying a saved view to the lifecycle being evaluated. The remaining records will make up the sample of prospects that will be included in the analysis.
- Click What-If, then click the + icon.
- Configure the analysis, then click Submit.
- The analysis will process and the status will change to Complete once it's ready. Select the analysis, then click View.

- Each record is assigned a What-if Score and Delta:
- The What-if Score is the new expected likelihood score as a result of the What-If actions that were applied. The new scores may be either an increase or decrease from the original Likelihood Score depending on how that specific action has historically influenced similar prospects.
- Delta is a calculated field which subtracts the original Likelihood Score from the new What-If Score. The difference in likelihood scores is a useful way to determine if your selected action is expected to have a meaningful influence for each individual prospect. Tip: sorting the Delta column by descending or ascending order makes it easier to find which prospects are most or least impacted by the What-If scenario.
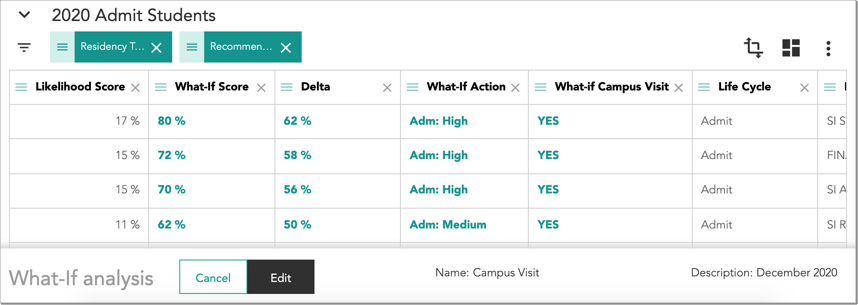
Note: the projected increases or decreases in total likelihood counts are reflected in the Visualizations and Prediction Overview area.
Creating a Sensitivity Analysis
A Sensitivity Analysis allow you to understand how the likelihood of an individual or group of individuals to enroll might change at various levels of financial support. This is achieved using the Othot prediction combined with What-if capabilities. You can easily simulate the expected change in Likelihood Score.
- Navigate to the Analyze tab in the Insights section.
- Configure the grid view by adding columns, applying filters, or by applying a saved view to the lifecycle being evaluated. The remaining records will make up the sample of prospects that will be included in the analysis.
- Click Sensitivity, then click the + icon.
- Configure the analysis, then click Submit.
- The analysis will process and the status will change to Complete once it's ready. Select the analysis, then click View.
- You can adjust the report output by adding/removing fields to the Filters, Rows, Columns, or Values section (similar to pivot table functionality); either select the field to add/remove or drag and drop the field. If you select a field from the Choose fields to add: section, ensure the field populated correctly in the Drag fields below: section.
- Tip: in most cases, the columns section contains the What-ifs variable(s) and the rows section contains the Aggregates variable(s) as selected in the sensitivity configuration. The values section should contain either the What-if Score, Delta, or both, depending on how you prefer to view the analysis.
- The Likelihood Score and Delta values are colored white, red, or green and are based on the Delta value:
- White indicates no change to the current likelihood score.
- Red indicates a negative change to the current likelihood score
- Green indicates a positive change to the current likelihood score.
- The darker the shade of red or green, the greater the negative or positive impact to the Delta score.
- To change the aggregate method (i.e. sum, average, count, etc.) or number format (i.e. integer, percent, etc.) of values in the report, right-click a field or cell to display a menu where you can select Field Settings.
- Tip: to view the predicted enrollment per cell in your analysis, change the Summary to Sum and Format to Integer (n0).
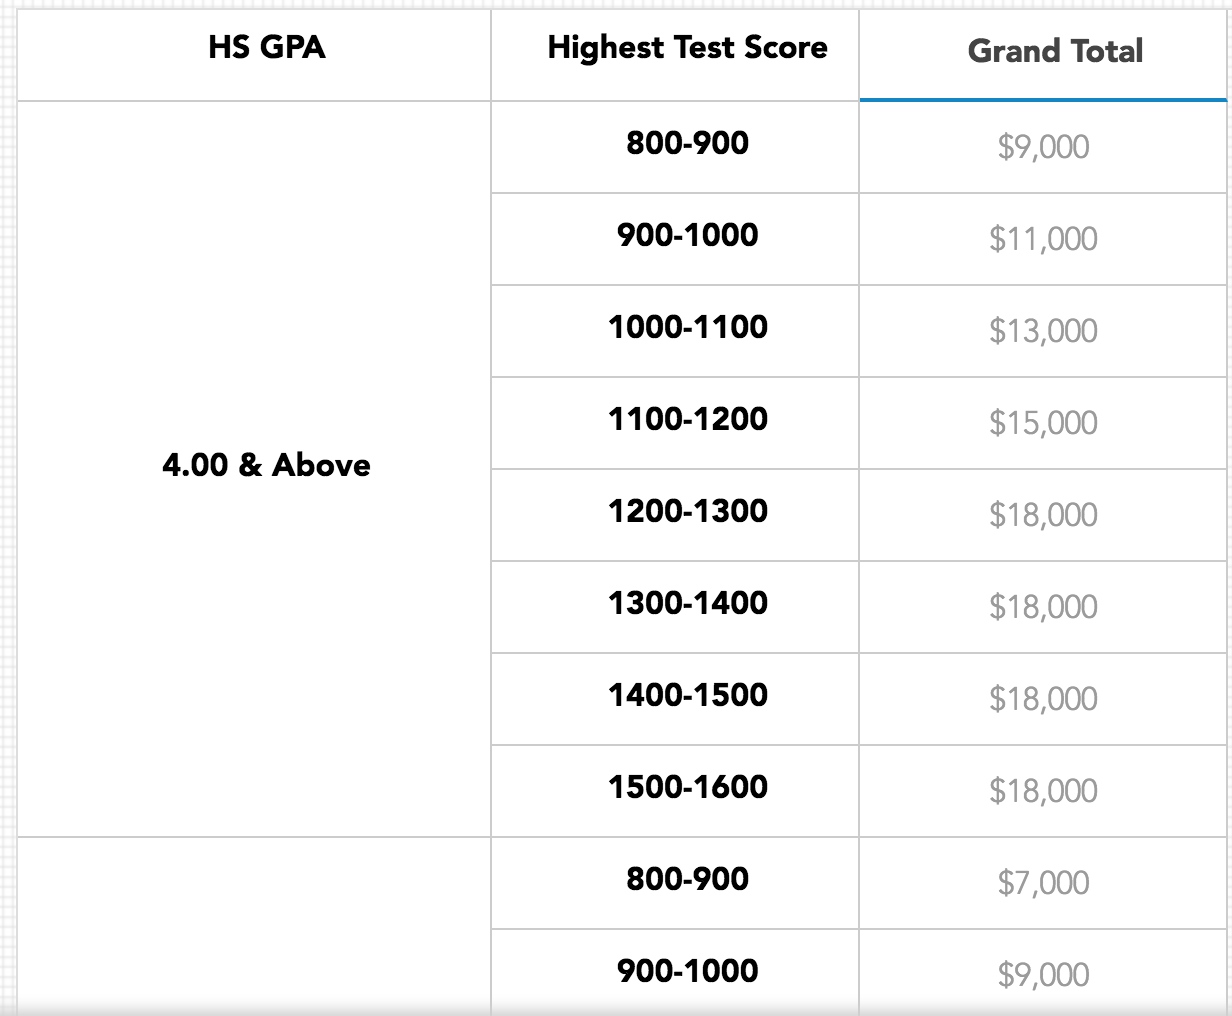
Creating a Matrix
The Matrix is a data-driven way to determine the optimal financial aid strategy that is expected to meet your institution's enrollment and strategic goals. Since Othot machine learning models understand the Sensitivity of institutional aid offers made to previously matriculated students, the platform is able to make offer amount decisions mathematically, then output a Matrix that is designed to yield the maximum expected enrollment for the lowest expected cost, all without sacrificing other strategic objectives.
- Navigate to the Analyze tab in the Insights section.
- Select the desired academic year and Lifecycle Phase from the Rewind menu (this will be the subject of your analysis). In most cases, we recommend selecting the Admit phase of a prior academic year to determine what the optimal financial aid strategy would have been to meet your institution's goals. Only students who have been Admitted will be included in a matrix.
- Click Matrix, then click the + icon.
- Enter a name and description.
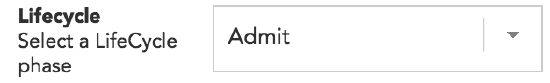
- Select the Lifecycle Phase that matches your selection from the Rewind menu.
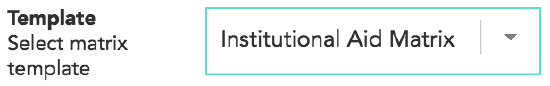
- Select the Matrix Template.
Note that each Matrix Template is custom configured by Othot. The templates are based on your specific requirements and determine the framework of the optimization calculation:- The Objective function (such as maximizing enrollment or minimizing the total amount of institutional aid expected to be disbursed).
- The grouping variables that students will be aggregated by (such as In-State/Out-of-State, High School GPA, or Highest Test Score).
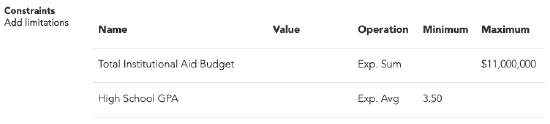
- The Constraints that align with the available grouping variables.
- Choose a Decision Selection:
- Automatically Optimize: allow the matrix to choose decision amounts to meet all objectives and constraints.
- Manually Enter: manually enter decision values into a blank matrix and see the predicted outcome.
- If you selected Automatically Optimize in the previous step, click anywhere on a row and enter the Minimum and Maximum Values that the resulting matrix must adhere to (i.e., the Constraints). For a matrix optimization with an objective to maximize enrollment, a maximum value must be set on a constraint related to the amount of aid to be offered. This ensures the resulting matrix does not exceed a budgeted amount.
- Click Submit.
- The matrix will process and the status will change to Complete once it's ready. Select the matrix, then click View.
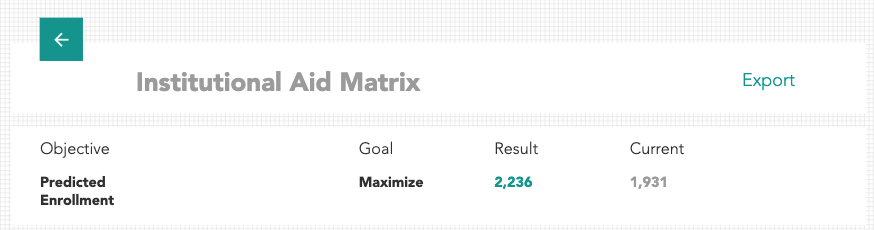
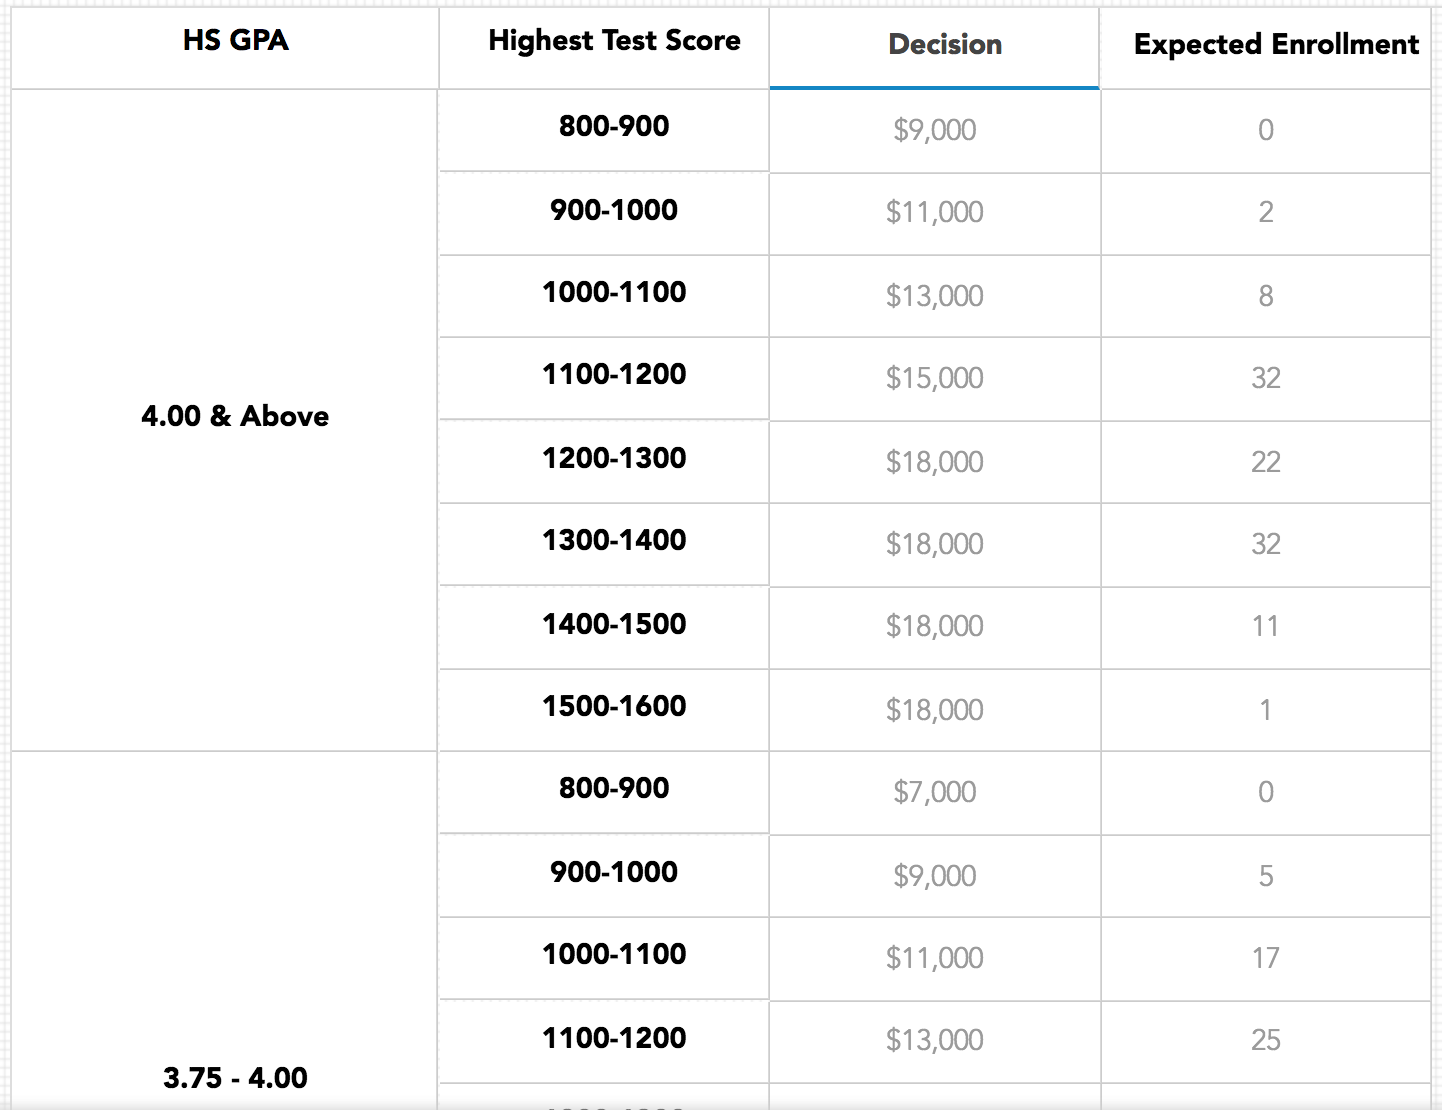
Overview of Matrix Results
The Objective section displays the optimal result for the goal that has been configured in the matrix template and compares it to the current value of the objective. Examples of possible Objectives may include:
- Maximize Predicted Enrollment.
- Minimize Predicted Institutional Aid Disbursed.
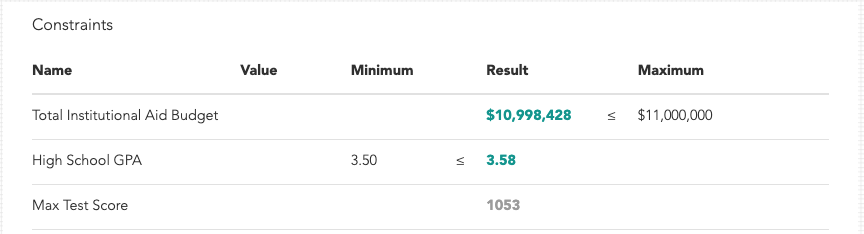
The Constraints section displays the expected results based on the requirements that were set when the matrix was created. The expected result for each constraint is located between the minimum and maximum values that were configured for the matrix.
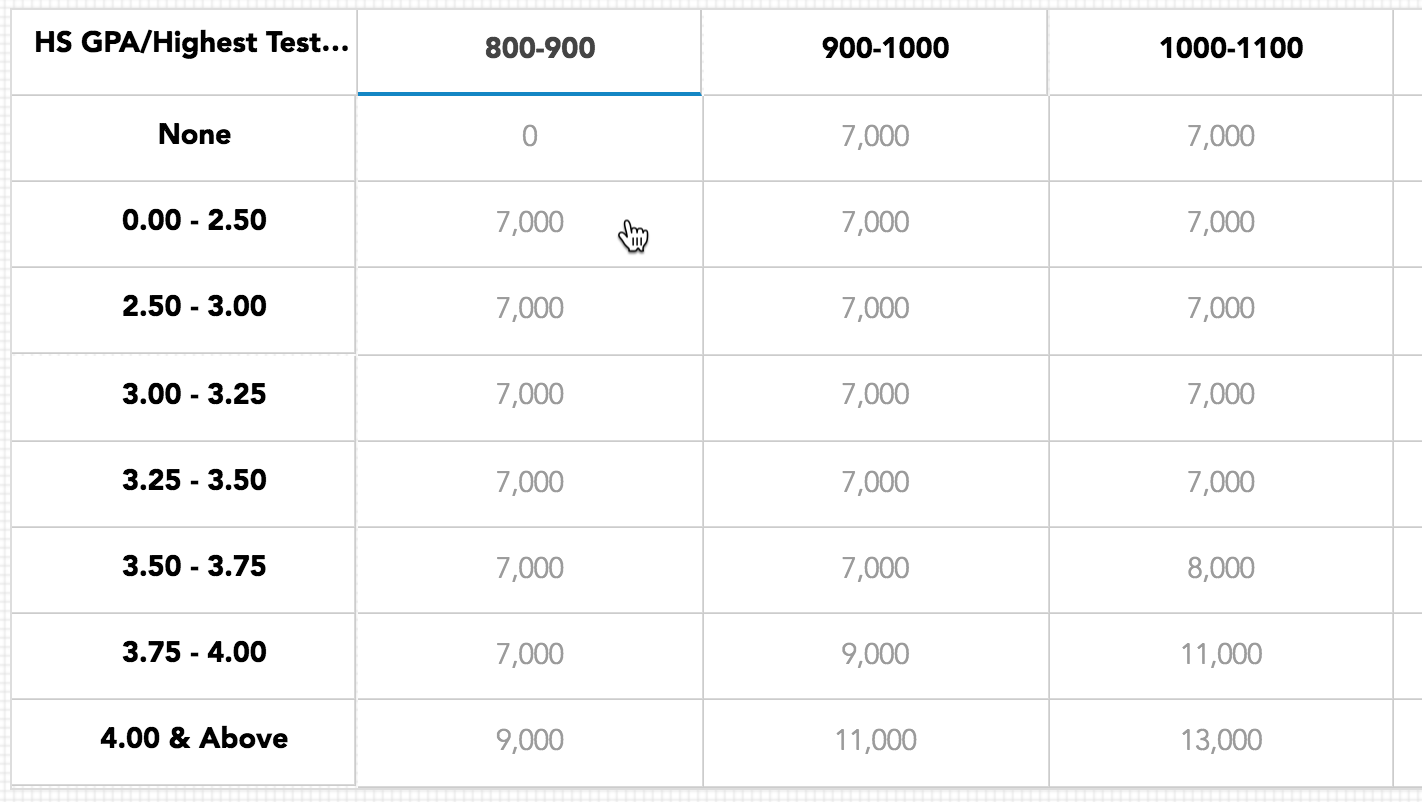
The matrix initially displays results with all grouping variables as rows. The values in the decision column are the financial offer amounts that the matrix determined would be optimal to reach the objective while meeting all constraints.
You can select a variable from the Primary Column drop-down to move it from rows to columns.
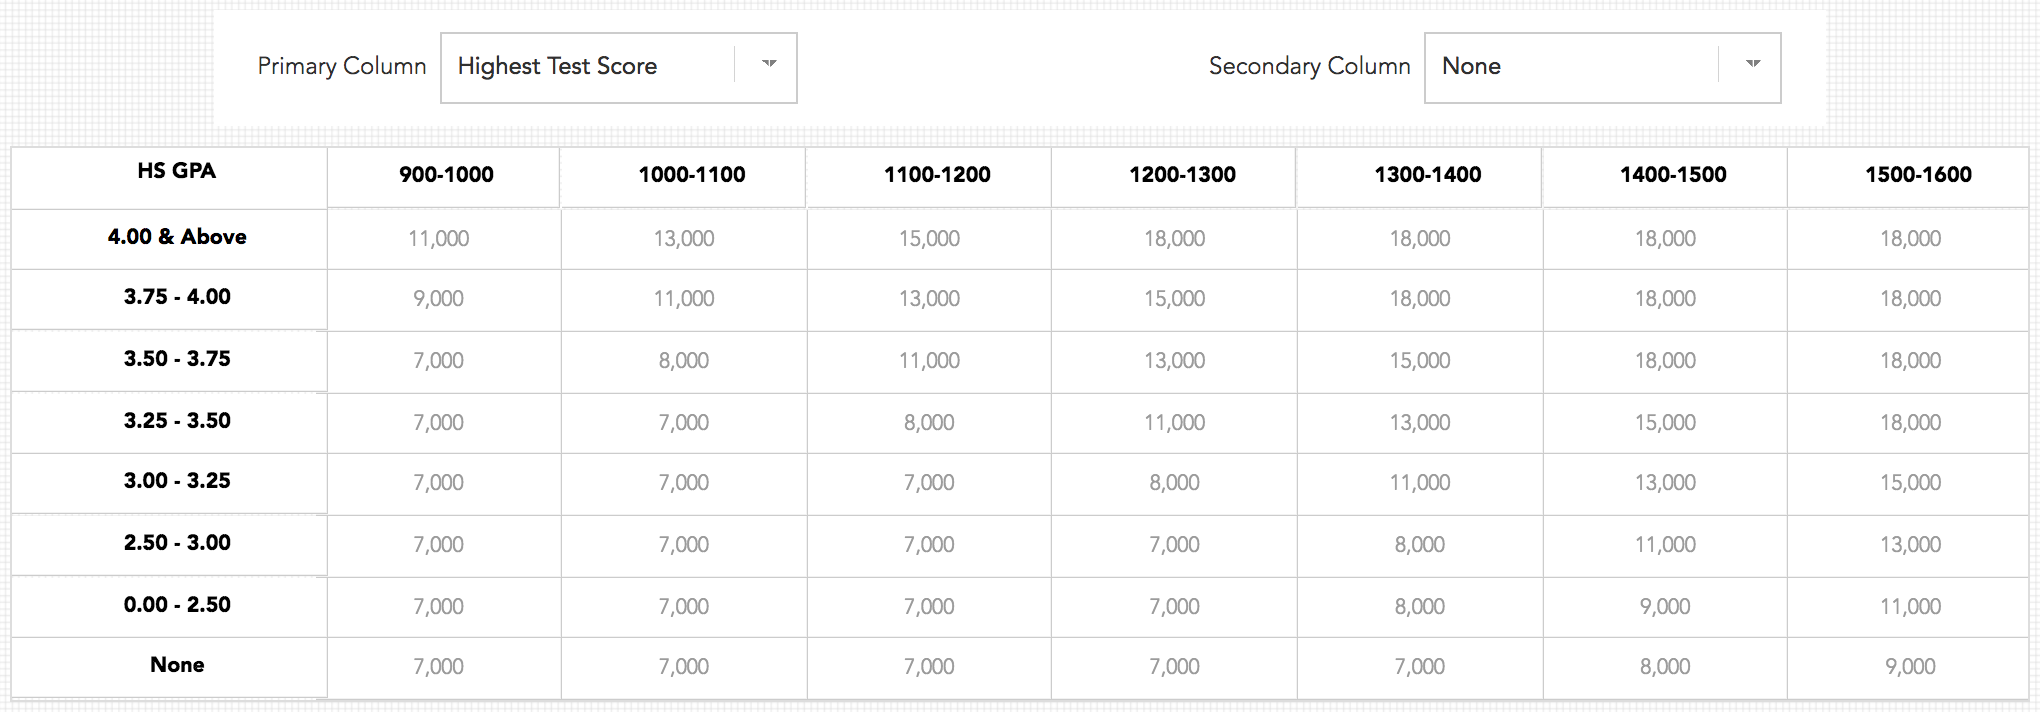
The Secondary Column adds the ability to see the expected enrollment or total record count next to each decision. This is useful for understanding the expected yield rate for each cell in the matrix.
Editing a Matrix
You may find that the optimal decisions for increasing enrollment or maximizing net tuition revenue are not always the most practical for your institution. That's why any Decision value can be edited and made a different amount, then you can see what the new expected impact will be as a result of your changes.
- When reviewing an existing Matrix, click Edit.

- Click the decision value cell you want to change.
- Select a new Updated Value, then click Apply.
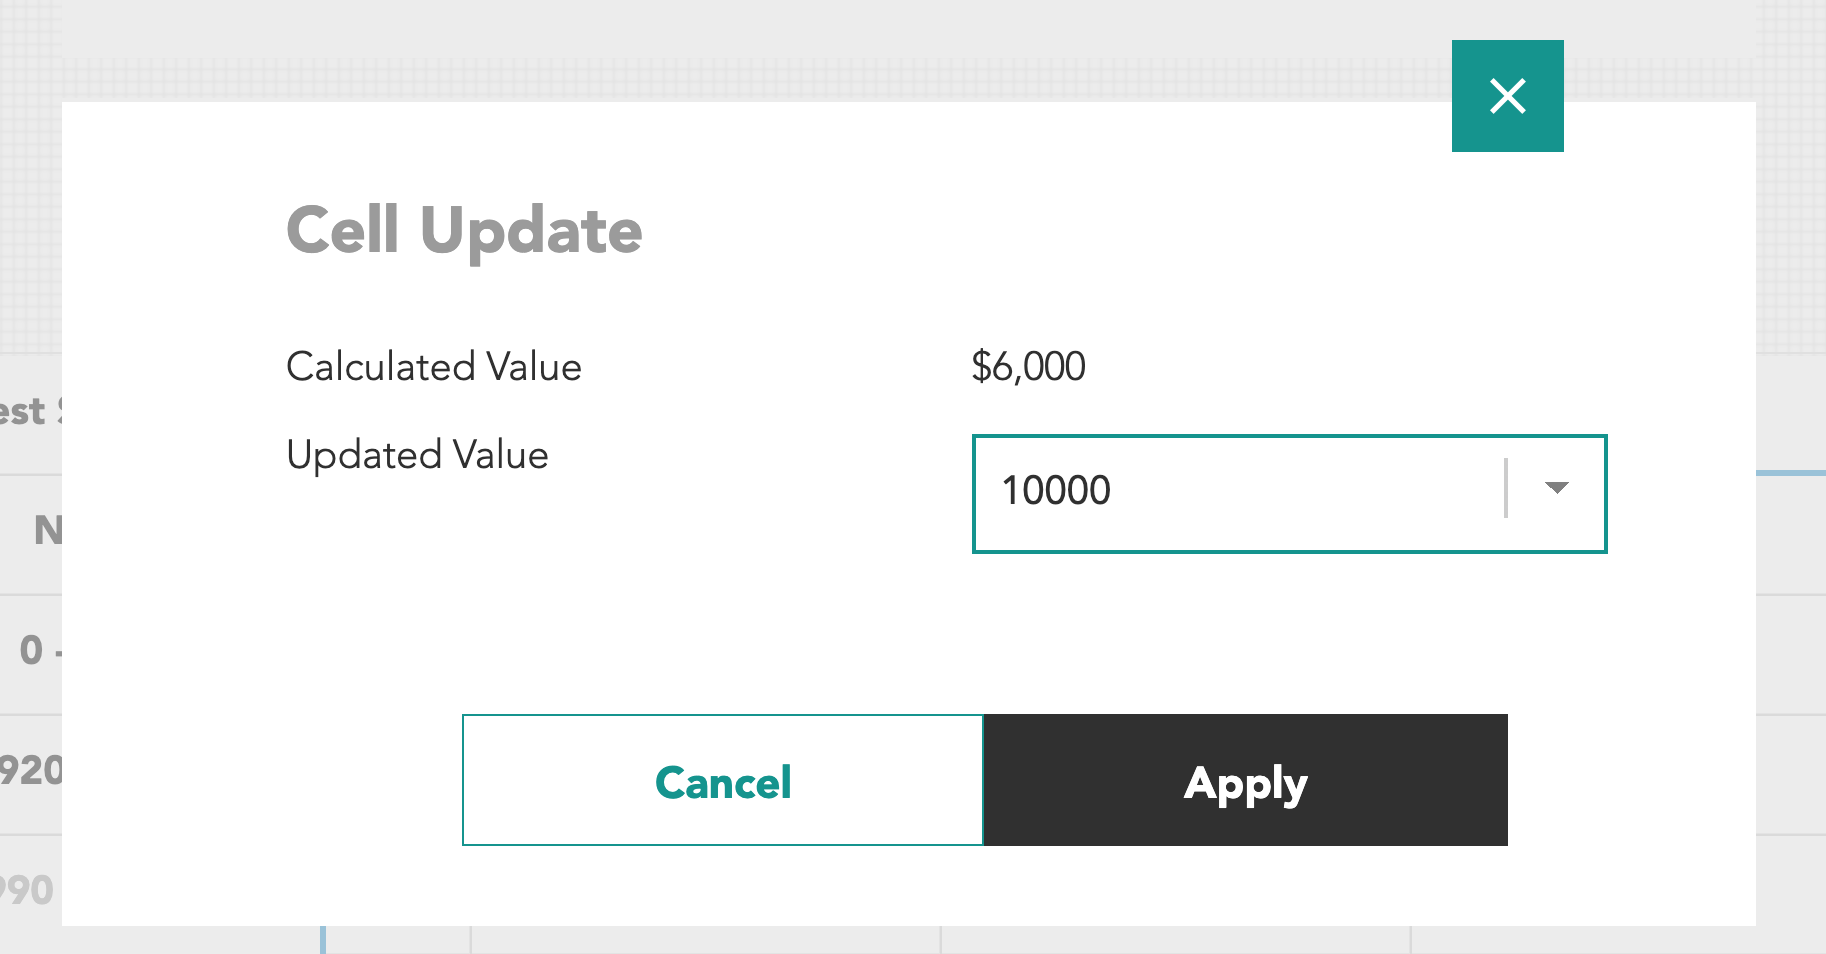
- When you're finished updating cells, click Update.
- The matrix will rerun with your changes. Note that any changes to decision amounts may result in the constraints no longer being adhered to; however, the results will reflect the expected outcomes as a result of the changes that were made from the optimal matrix results.
Matrix Improvements
Several features have been added that make testing and predicting the results of financial aid strategies a better and more comprehensive experience:
Clone Matrix Contents
Duplicating an existing Matrix now carries over all decision values from the source. This saves you time when making minor tweaks to an aid strategy while maintaining the insights from the original saved Matrix.
Show All Possible Aggregate Combinations
All combinations of variables used to group students in a Matrix now populate even if zero student records meet the criteria. This enables users to still select decision values for the subpopulations if a new student, who meets the aggregate combination, enters the funnel at a future date.
Financial Aid Decision Warnings
By request, a warning can be set to flag increases or decreases in financial aid awards that exceed desired levels for cells in a Matrix. This feature notifies institutions if they could be offering significantly different awards from the original award offer.
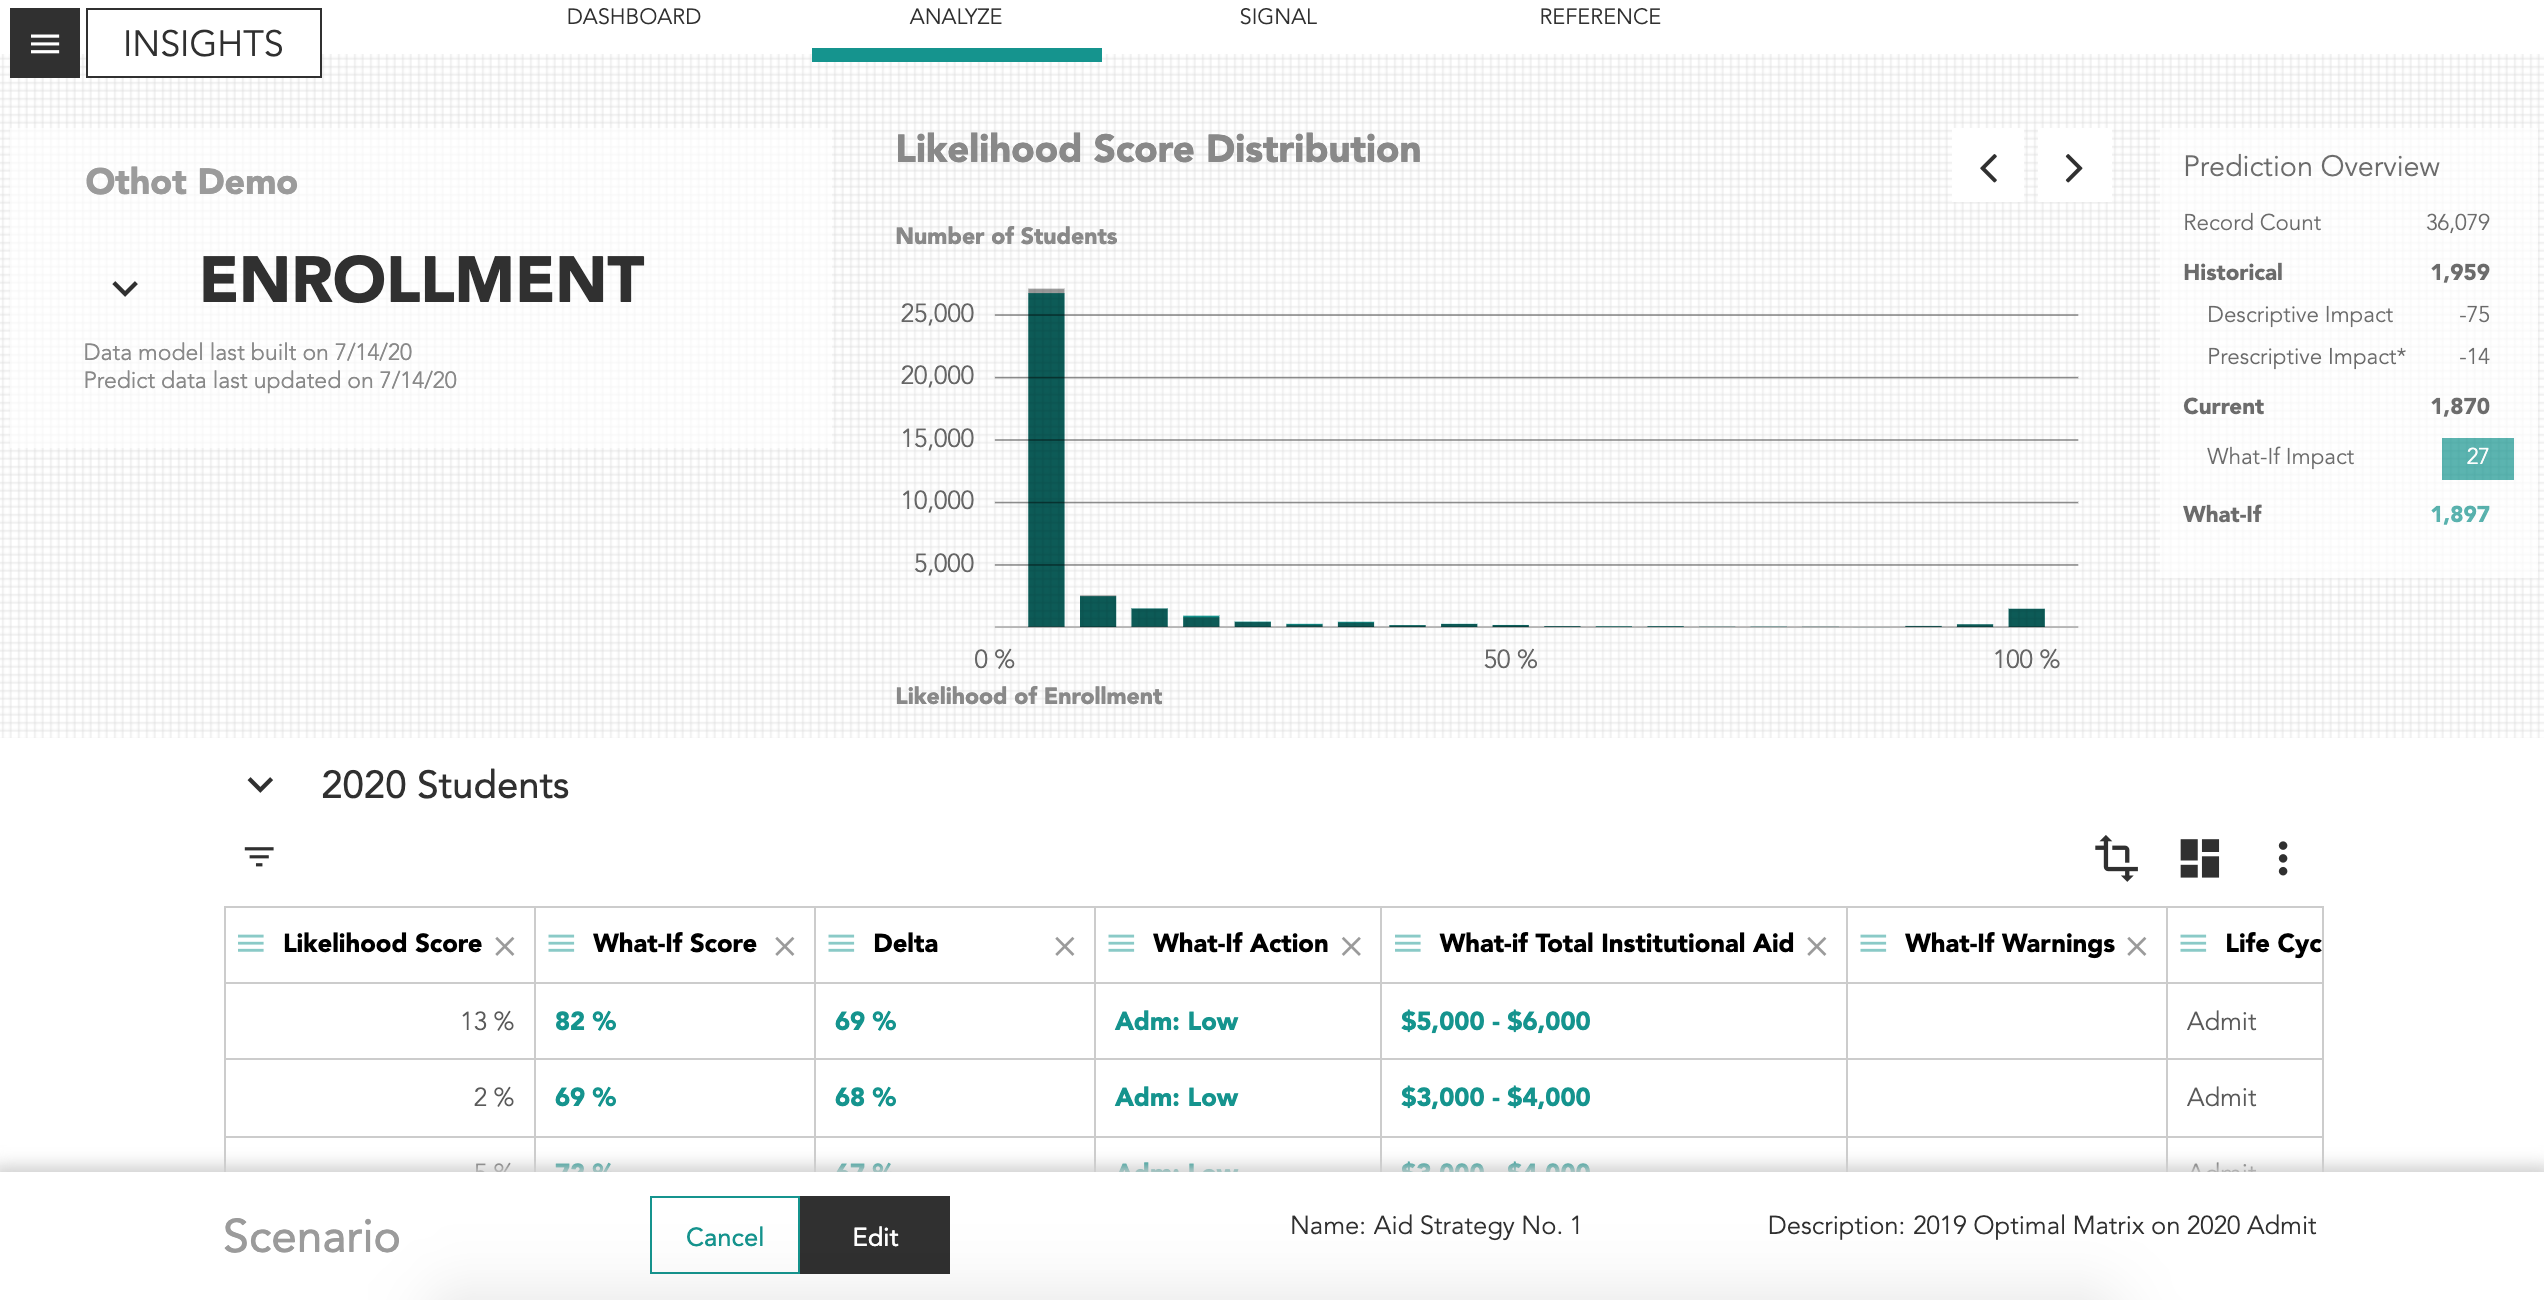
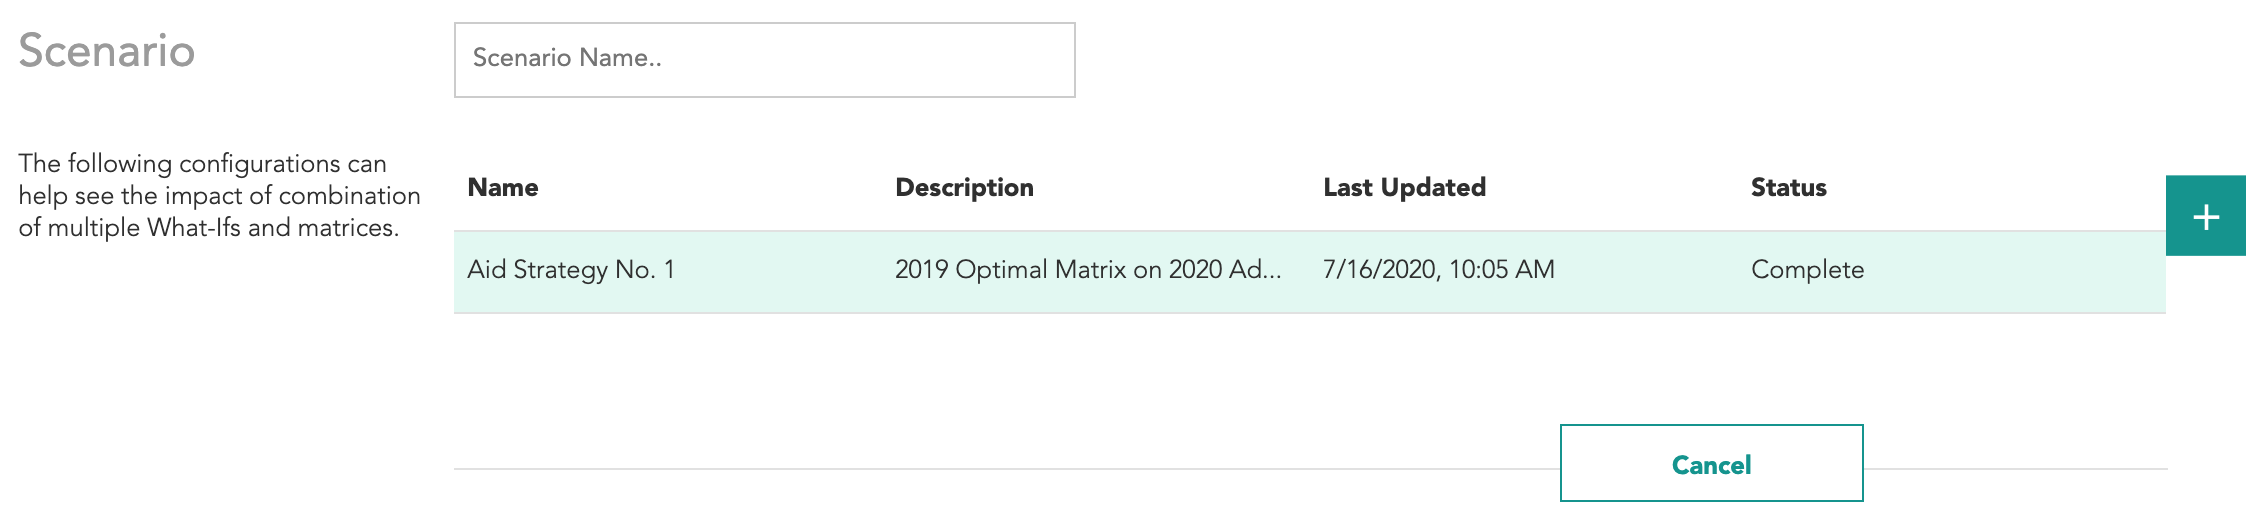
Creating a Scenario
The Scenario module enables you to simulate what happens if multiple strategies are enacted, such as modifications to a financial aid strategy while also being more effective with marketing or recruitment activities by combining multiple Matrix and What-if simulations. This feature builds on Othot's prescriptive analytic capabilities to enable institutions to predict outcomes for situations before taking on any risk.
Any completed What-If or Matrix can be applied and stacked to show the predicted outcome if each of the selected tactics were applied.
Similar to a What-If, the What-If Score and Delta columns will appear for every record in the Grid of the Analyze page for a completed Scenario. See which students are predicted to be the most positively and negatively impacted by your potential decisions, including if a Matrix was adopted and applied.
- In order to create a Scenario, you must first have completed a What-If analysis or Matrix optimization.
- On the Insights page, configure your View by adding any columns and applying filters, or by applying a saved View. The remaining records will make up the sample of prospects that will included in the analysis.
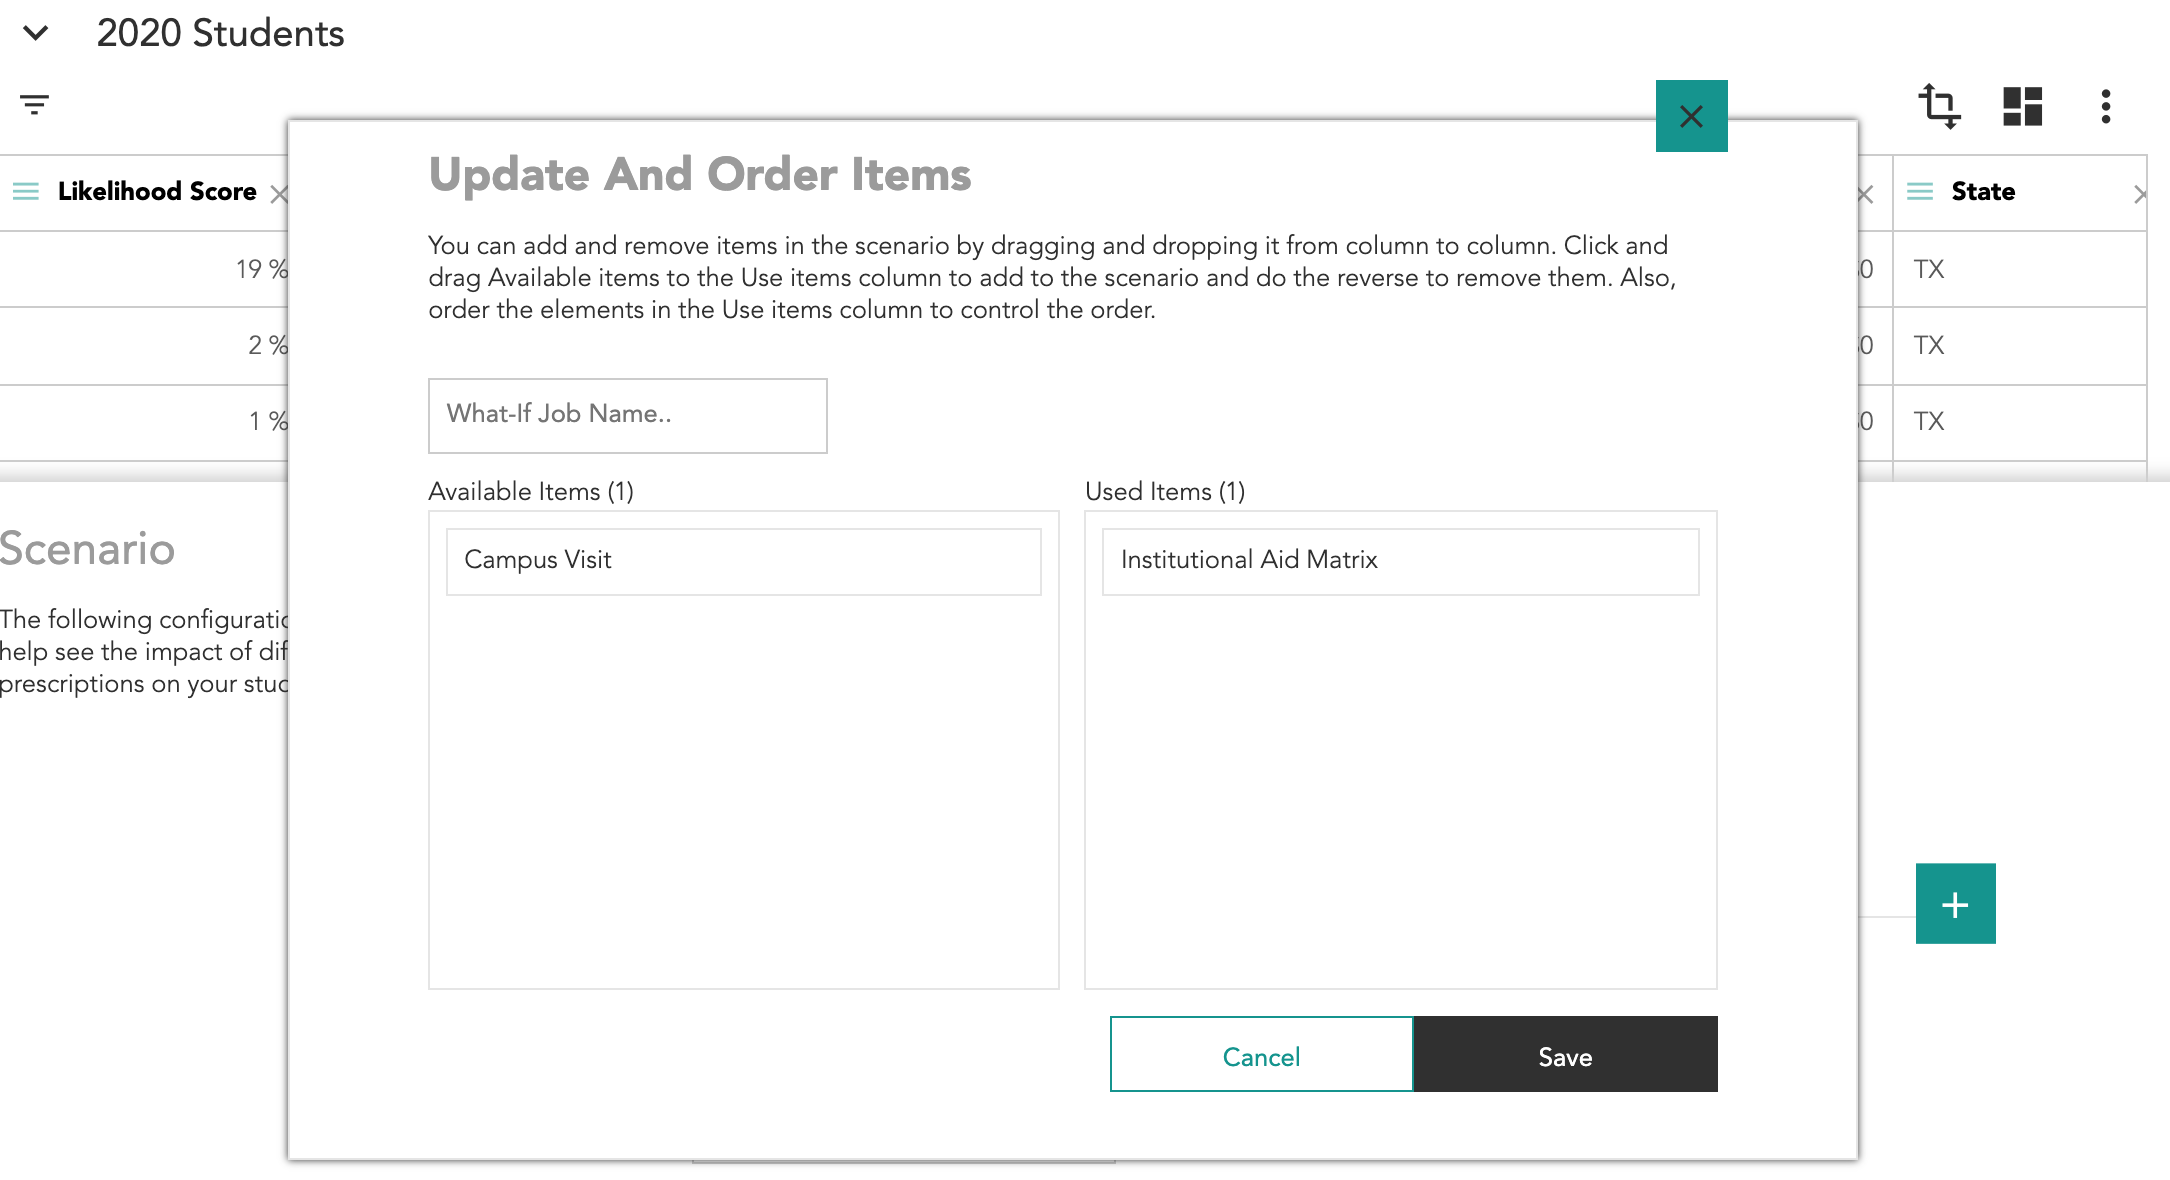
- Click the Scenario button, then click the + icon to create a new Scenario.
- Give the Scenario a Name and Description, then click the + icon.
- Click and drag and completed What-If or Matrix items to the Used Items section. Then click Save.
- The Scenario may take a few moments to run. When ready, its Status will read Complete and a notification email will be sent to the address associated with your account. Click on your completed analysis, then click View to open it.
- Click the View button to show the Scenario. The results for each individual student, as well as in aggregate in the Prediction Overview, will be shown in the same manner as a singular What-If Analysis.