Configuring Insights Settings and Preferences
Mapping
Settings & Preferences allow you to configure your Data Field Mappings and Standardized Value Mappings. You will be presented with your Existing values and need to assign each to the appropriate TargetX category.
Field Mapping is the process used to tell Insights which source fields from your CRM to use in populating your data visualizations. The main page for Field Mapping will show the list of all of the data points Insights uses (broken up into sections based on topic), with the following details for each Insights data point:
- Whether the field is required for Insights to populate your data (while all fields do contribute to the visualizations in Insights, some fields are required to be able to run the data update process)
- The Information icon will show you a description of the field and the default field for your CRM
- The source table your mapped field is coming from
- The source field that is currently mapped for that Insights data point
- The status of that field's mapping
To update any of your mappings, click the Edit icon for the Section you want to update. The side panel will pop up showing the same information as the main page but a drop-down menu containing all of the available fields that can be mapped to the Insights data point, including any custom fields you may have added to your CRM. Available fields will be located on the specified source table and filtered based on the field type that Insights requires the data to be in (for example, for the Application Started Date, only fields formatted as date fields will be pulled into the drop-down menu).
How to Edit Insights Data Field mappings
- Login to Insights
- Navigate to Settings.
- Click mapping, then Data Fields.
- Click the Edit icon [
] for the Section of fields you wish to update. The Data field mappings are displayed in the following Sections:
- Application
- Counselor
- Event Registrations
- Events
- Feeder Schools
- GPAs
- Prospect/Inquiry
- Standardized Tests
- Student
- Select the new/updated Mapped Field for your selected field.
Note: Click the i next to any field you wish to see more information, such as Description or Standard Field.
- Once you have completed all the changes you want to make within that Section of data points, click the Update button at the bottom of the side panel. You'll be returned to the main page.
- Complete any other updates needed in the different sections of data points the same way.
Note: all fields you change will change to the status Updated, but your changes are not yet finalized!
- To finalize your changes, click the Apply button in the notification bar at the top of the main page.
- Once you click the Apply button, your work is done, but Insights will complete the following things to finish your updates:
- All the fields you made changes to will change to the status Pending, which means that you have locked in your changes, and Insights will pick up those mappings the next time the data refreshes.
- Your data in Insights will refresh on its regular cadence, and the new mappings will change from Pending to Applied.
Values will display as:
- Updated - when values are changed but NOT yet applied/updated.
- Pending - Once changes have been used but not yet processed.
- Applied - Once updating is complete, the Status will display as Applied.
How to Edit Insights Standardized Values mappings
Several data points in Insights require you to map your custom values onto some standardized values defined in Insights. This is the process by which you can map those values.
Note: if you update the Field Mapping for any data points requiring Standardized Values, you will need to complete the Standardized Value mapping process again once the Field Mapping is applied.
The Standardized Value Mapping main page is similar to the Field Mapping main page. Each Section corresponds to one field (like Student Level), and the Insights Standard Values for that field are listed in each Section.
To update your Standardized Value mappings, click the Edit icon for the field you want to update. The side panel will pop up, showing a drop-down menu containing all the available values for your selected field, including any custom values you may have added to your CRM.
Updating your Standardized Values is the same as Field Mapping, with just a few key differences, noted in italics here.
- Select the new source value you want to map to the Standard Value from the drop-down menu.
- If there are multiple source values that correspond to one Standard value, click the plus sign to add another drop-down.
- Once you have completed all the changes you want to make within that data point, click the Update button at the bottom of the side panel. You'll be returned to the main page.
- Complete any other updates needed for different data points the same way. Note: all values will have their status. Any values that have been changed will change to the status Updated, but your changes are not yet finalized!
- To finalize your changes, click the Apply button in the notification bar at the top of the main page.
Once you click the Apply button, your work is done, but Insights will complete the following things to finish your updates:
- All of the values you made changes to will change to the status Pending, which means that you have locked in your changes, and Insights will pick up those mappings the next time the data refreshes.
Your data in Insights will refresh on its regular cadence, and the new mappings will change from Pending to Applied.
Values will display as:
- Updated - when values are changed but NOT yet applied/updated.
- Pending - Once changes have been used but not yet processed.
- Applied - Once updating is complete, the Status will display as Applied.
Targets
Targets are the Goals you set for a Term. These Targets will be used to track your progress in the dashboards.
Set the values to track against for any term. Click + to Add Targets for Another Term, select a term with no targets set yet, and enter your goal numbers for both Applications and Enrolled. Anytime you access a Dashboard that shows progress toward targets, you'll see the appropriate calculations based on the term you're viewing.
- Total number of students you are hoping to Enroll. This will display on the Overview Dashboard.
- Total number of applications you are hoping to receive. This will display on the Overview and Applications Dashboards.
To edit existing targets, select the Edit option from the menu alongside the term for which you wish to edit targets.
To copy targets from an existing term to a new one, select the Clone option from the menu alongside the term you wish to clone from. Select a term with no targets yet and save to get an exact copy of all targets, or continue editing to add to or modify the values pre-filled from the term you selected to clone.
Supported Targets
- Enrolled - What is the total number of students you hope to enroll for the selected term? Used on the Overview Dashboard.
- Applications - What is the number of applications you are hoping to receive for the selected term? Used on the Overview and Applications dashboards.
Supported Categories
- Academic Program
- Student Type
- Student Level
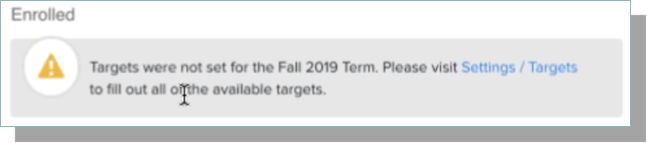
If a Term does not have Targets defined, a message will display on the Dashboard indicating that:
Filter Groups
Filter groups allow Administrators to group common filter criteria that users can easily access. For example, you can create a Filter group for each department, including all the Programs within that department. This enables Users to select a single Department rather than searching for each program.
Create a filter group for a specific Department:
- Navigate to Settings > Filter Groups.
- Click the + to add a new filter group.
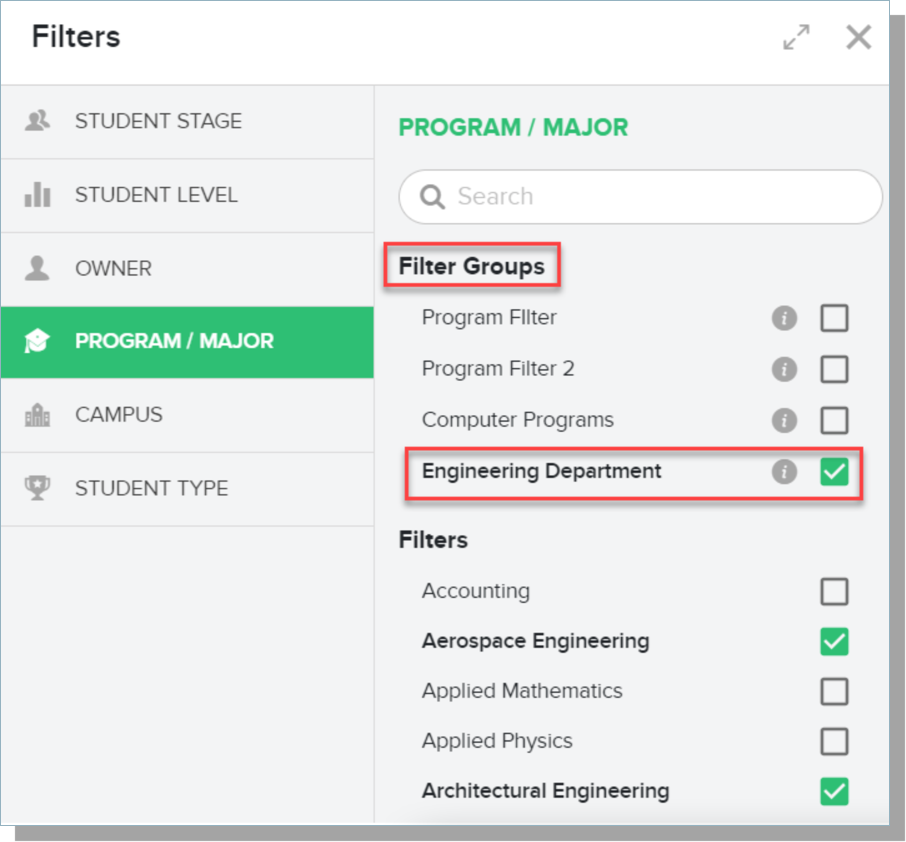
- Enter a Name for the group, such as Engineering Department.
- Select the Category of Program/Major.
- Search the available Programs/Majors list, and select those that are part of the department you are creating. As you select values, they will display at the top of your group with a green checkmark. If needed, you can click the green checkmark to remove them.
- Click Save.
To view the filter group you created:
- Navigate to a Dashboard.
- Select the Filter icon.
- Click the category you used for your Filter Group.
- Your Filter Group will display at the top of the list of available filters.
- The information icon will display the values you selected for the Filter Group.
Users
The Users section allows you to view and manage role-based access to dashboards for your users. This Section is only available to Insights Administrators.
After a user from your organization has logged in to Insights, their user account appears here. The Users window allows Administrators to view your institution's Users and the Dashboards they can access.
To edit the roles associated with the user, click the pencil icon [] in the Roles column of the Users list, and select or deselect any role assignments you wish to modify. The Dashboards column indicates the number of Dashboards to which the user has access. Clicking the number link will display the Dashboards assigned to the user. The available dashboards are configured in the Roles & Permissions section.
Roles & Permissions
The Roles & Permissions section allows Administrators to select which Dashboards a Role can access in Insights. This Section is only available to Insights Administrators.
The available Roles are:
- Default includes Applications, Student Demographics, and Overview dashboards by default.
- Admin includes access to ALL dashboards by default.
- Admissions Staff includes access to ALL dashboards by default.
- Senior Administrator includes access to ALL dashboards by default.
To modify the Dashboard permissions for a role, select the role, expand the Dashboard list for the area you want to change, and select or deselect the dashboards you wish to be visible to users that have this role assigned.
The Roles available by default
- Admin: includes access to ALL dashboards by default. This role also grants access to all administrator settings. This role cannot be modified or deleted.
- Default: includes access to ALL dashboards by default. This role is assigned to all new users by default.
To modify the Dashboard permissions for a role, select the Edit option from the menu alongside the role. On the edit page, select or deselect the dashboards you wish to be visible to users that have this role assigned.
To change which role is assigned to new users by default, select the Edit option from the menu found alongside the role you wish to make the new default. On the edit page, update the Default Role toggle. A default role must always be assigned.
Adding a New Role
- Click the + Add Role option.
- Enter a Role Name.
- Select the Dashboards that should display for the user.
- Click Save.