Personalizing Dashboards
Viewing Standard Dashboards
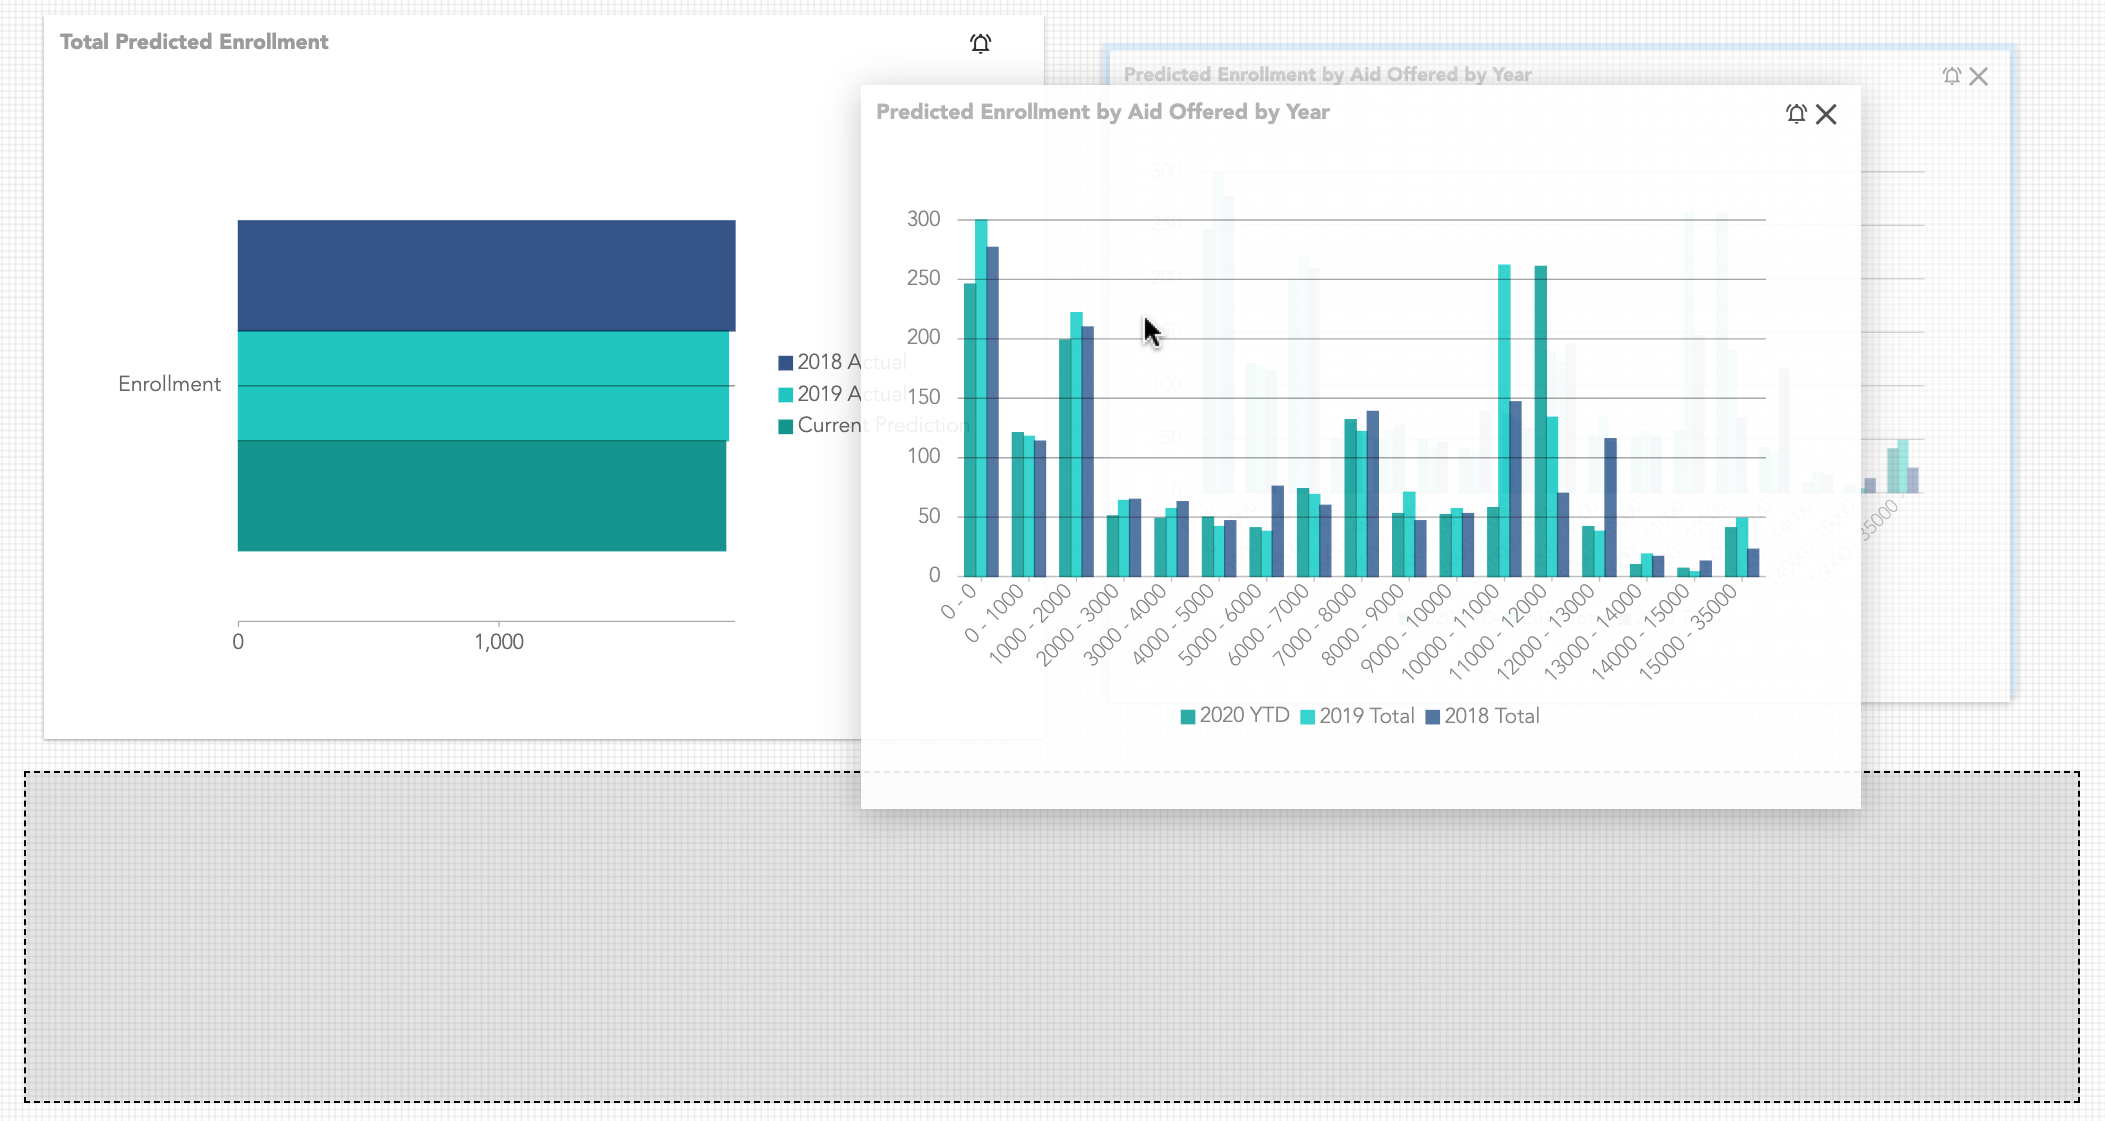
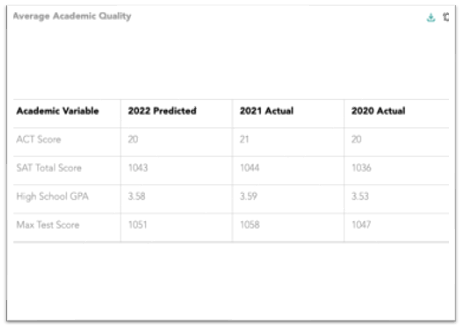
The Dashboard is a highly configurable page that enables you and your team to visualize your institution's key metrics and goal progress with charts, graphs, and tables. Several standard dashboard templates are enabled by default. These charts are intended to provide a high-level overview of where your institutions efforts towards enrollment or retention goals currently stand, as well as trends in comparison to prior years.
- Navigate to the Dashboard tab in the Insights section.

- Select the product.
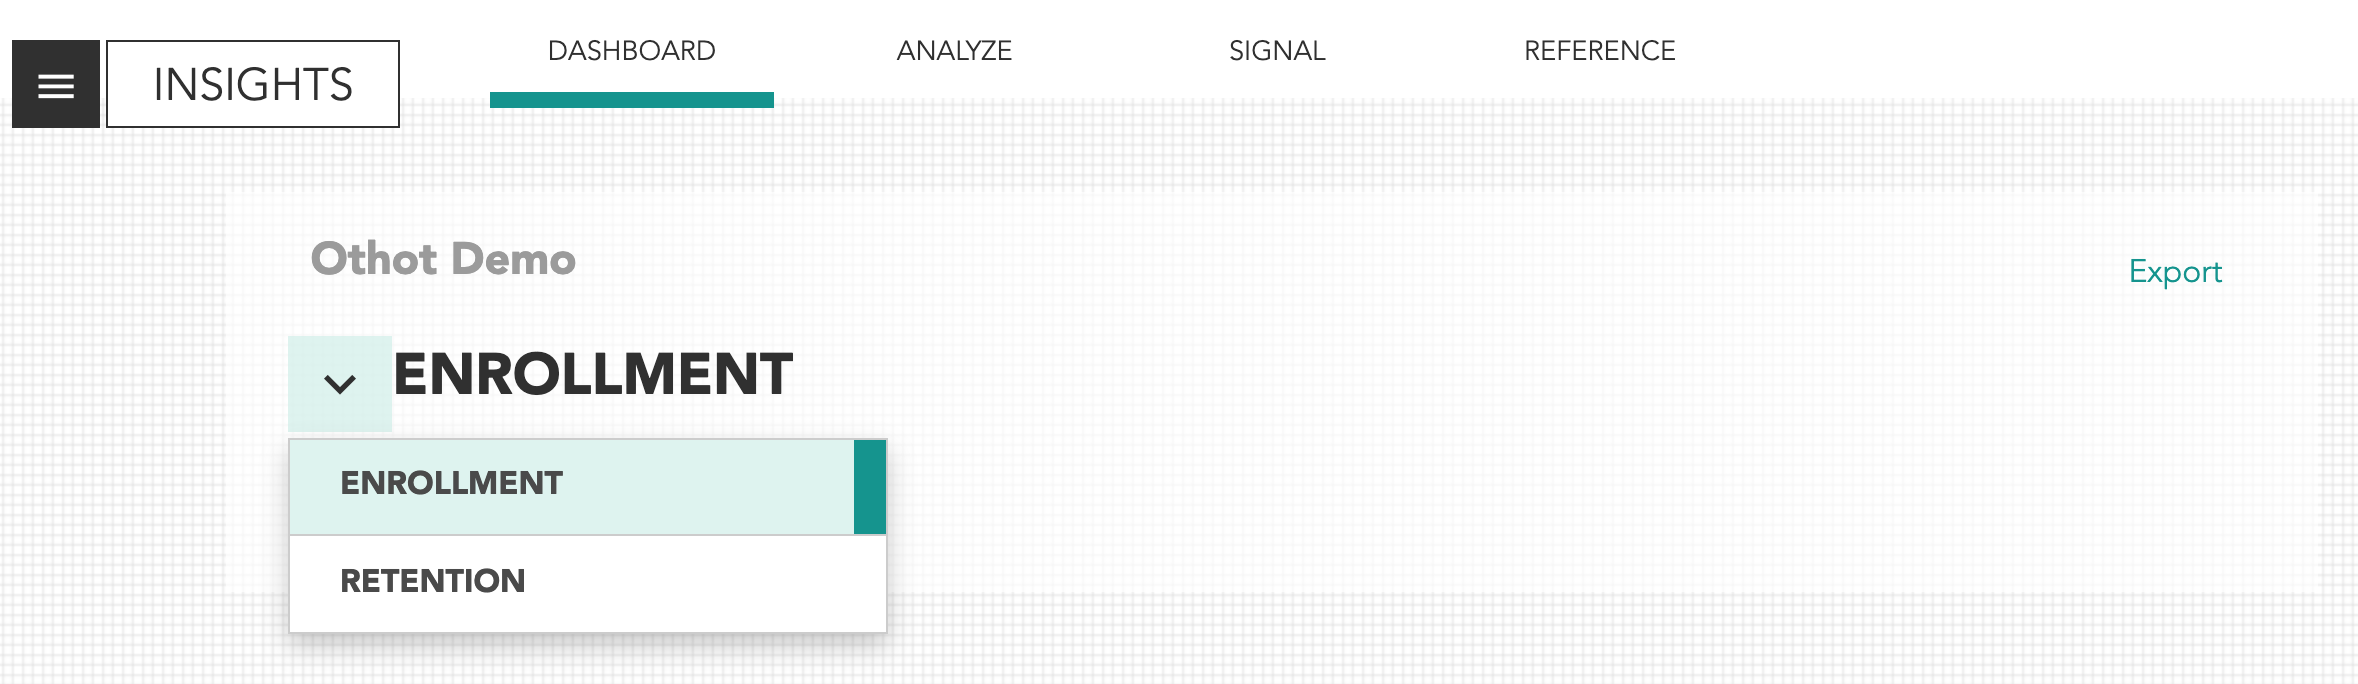
- Click Select at the bottom of the page.

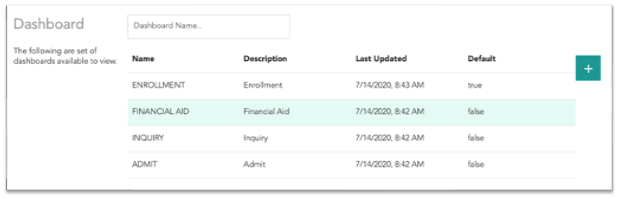
- Select a dashboard from the list.
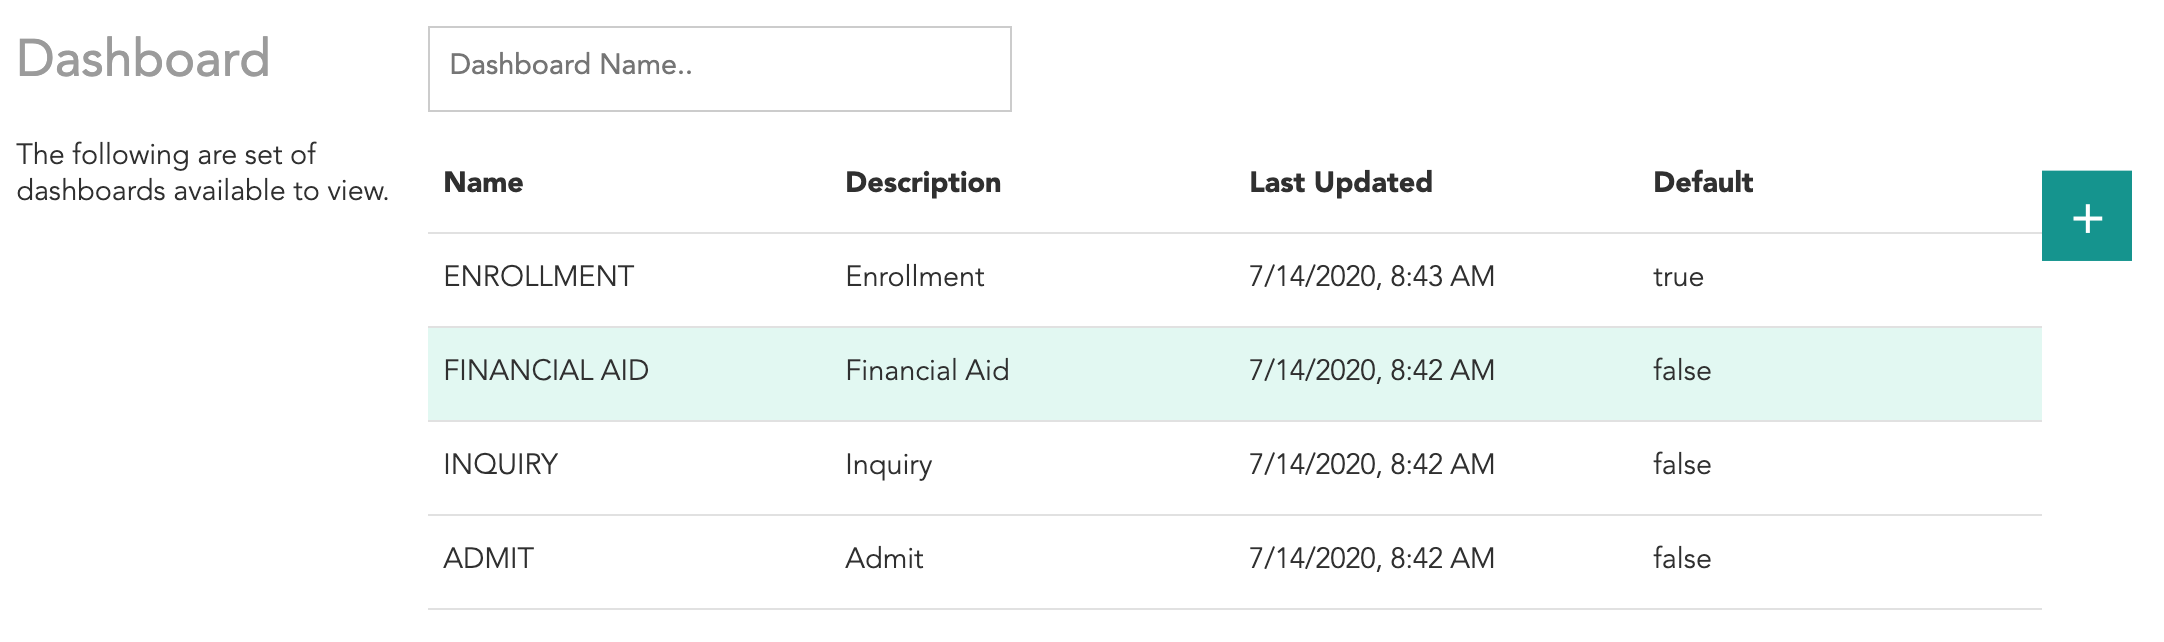
- Click View to open the dashboard.

Creating and Customizing New Dashboards
Step 1: Create the Dashboard
- Navigate to the Dashboard tab in the Insights section.
- Select the product.
- Click Select at the bottom of the page.
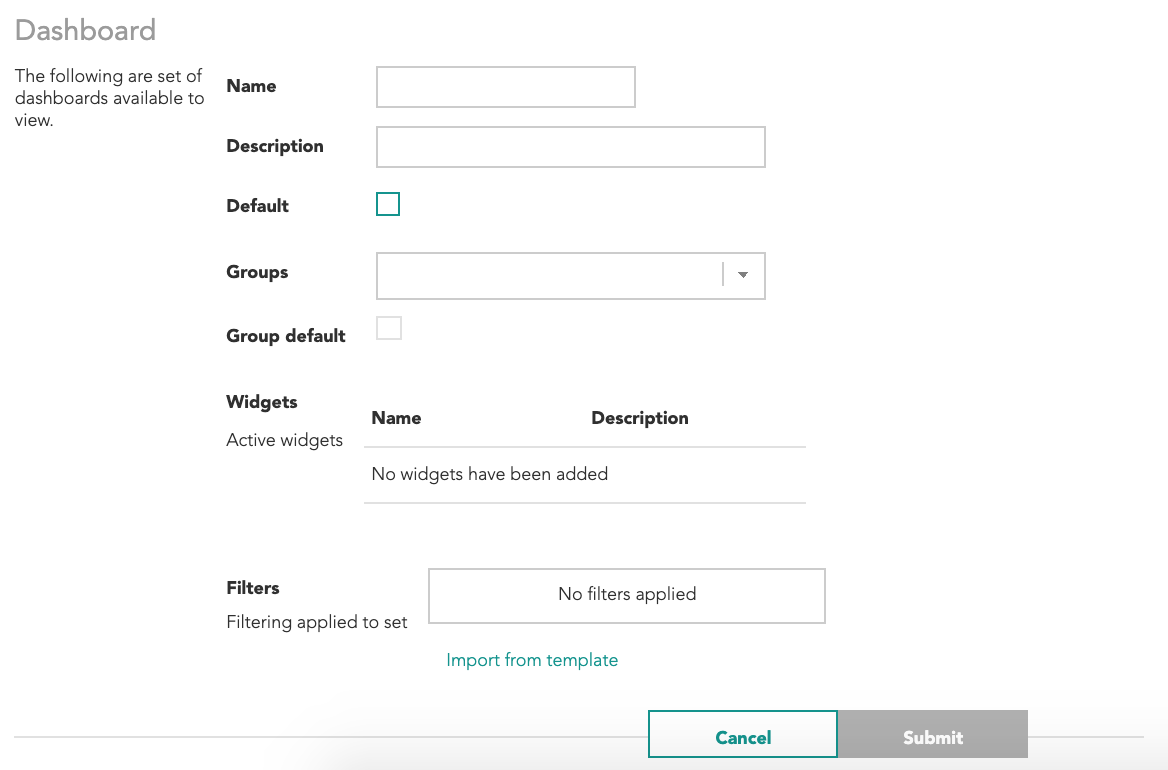
- Click the + icon.
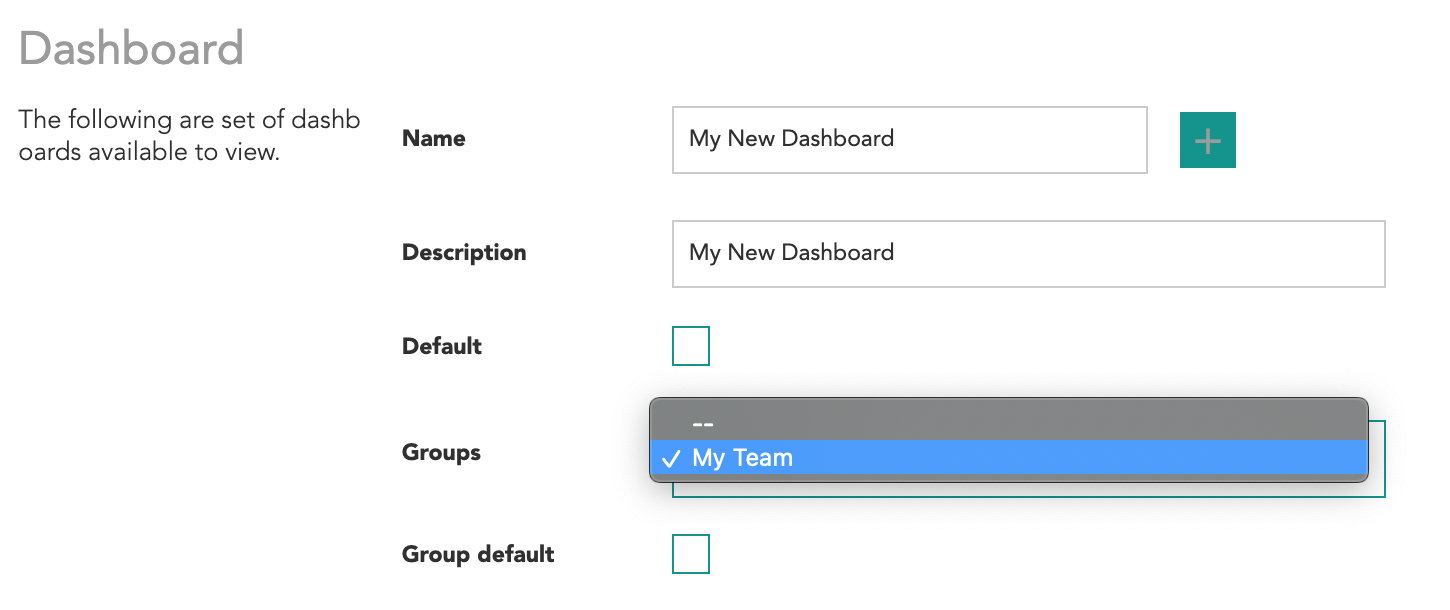
- Create the dashboard, then click Submit.
- Select the dashboard from the list.
- Click View to open the dashboard.
Step 2: Customize the Dashboard
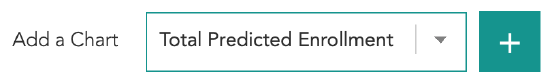
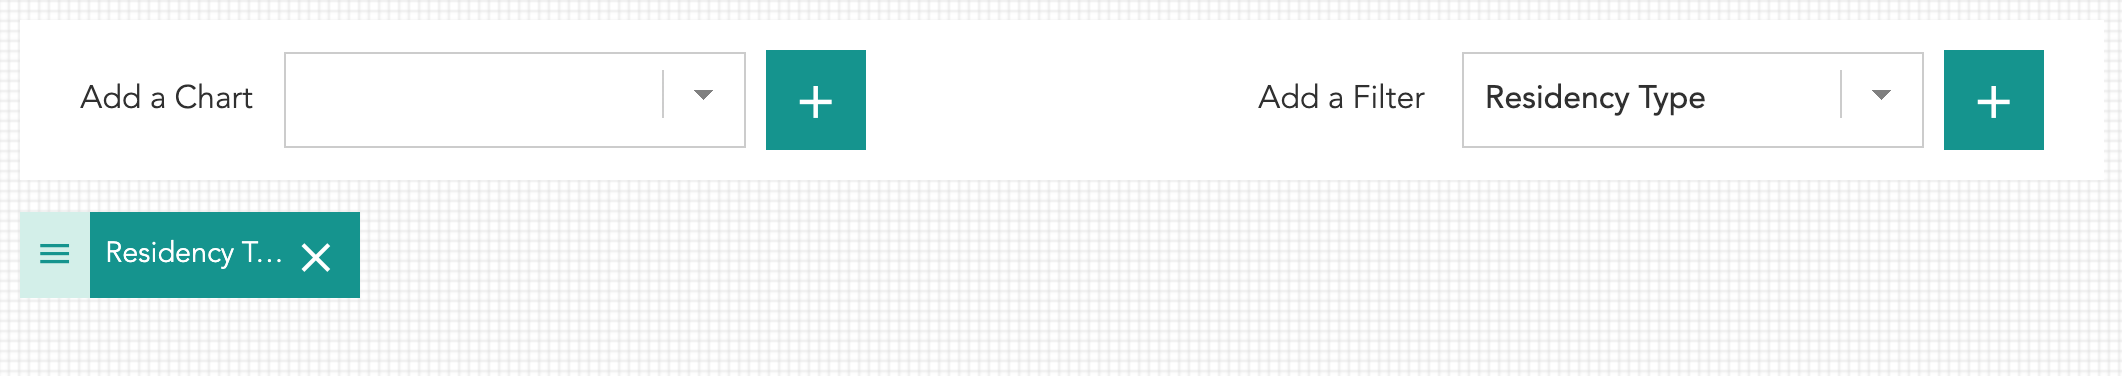
- Select a chart from the drop-down menu, then click the + icon.
- Once multiple charts have been added—and while still in edit mode—you can rearrange the placement of a chart by dragging it to another available space.
- To filter the results in a Dashboard, select a variable from the drop-down menu, then click the + icon. You can create multiple filters.

- To set your filter, click the = icon and make your selections. All of the charts in your dashboard will be updated to include the filters you've applied.
- Click Save.
Duplicating a Dashboard
- Select the dashboard you want to duplicate.
- Click the + icon
- Rename the dashboard, then click Submit.
Sharing Access to a Dashboard
- Select the dashboard you want to share.
- Click the + icon
- Choose a Group from the drop-down menu. You can also select the Group default box to make this dashboard the primary dashboard for the group.
- Click Submit. If you want to create a PDF or print your dashboard, click View and then click Export in the top right corner of the page.
Exporting a Dashboard Table Widget
When viewing a dashboard with a table widget, click the download icon in the top right corner to export the table to a .csv file.
Scheduling Dashboard Report Emails
- Select the dashboard.
- Click the + icon
- In the Signal Schedule parameter, choose one of the following default report frequencies:
- None: an automated dashboard report will not be run or sent.
- Weekly: an automated dashboard report will be run and sent every Monday at 12:00 PM ET.
- Monthly: an automated dashboard report will be run and sent on the first day of each month at 12:00 PM ET.
- On Change: an automated dashboard report will be run and sent each time new or updated data is received for predictions.
- Click Submit.
When a dashboard report runs, you'll receive an email with a link to view it in the Signal tab in the Insights section.