Understanding Your Model
Who builds the model and when?
To ensure quality, models are updated by the Othot Data Curation and Othot Data Science teams only. The Othot team uses the Model page to make the models that were tested and reviewed on internal tools accessible to you in the Othot Platform.
Generally, your model will be rebuilt at least once a year after the academic year's enrollment cycle is complete. In this process (called a Rollover), the newly completed year of data is added to the historic/train data and used to make predictions for the upcoming year.
While we attempt to keep the number of updates to models to a minimum to avoid disruption and changes to predictions, your model may also be updated at other points in the year to make changes or include additional variables that are necessary for making decisions and building your strategy. These model updates will be coordinated via your Strategic Partnership Manager.
How to better understand your model
The Reference section of the Insights page is the most comprehensive source for the details of your model.
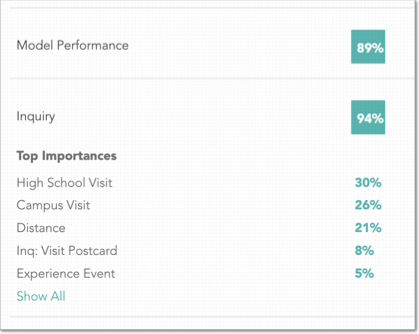
What is Model Performance?
Othot measures the performance of our predictive models by taking the average of three metrics:
- Aggregate Accuracy - measured as the total predicted enrollment versus actual results
- Individual Accuracy - measures how well the model predicts whether an individual would enroll or not
- Rank Accuracy - expresses how well individuals were ordered by their probabilities
Since Othot builds detailed models for each phase and each phase includes a different set of variables, the overall performance and the individual predictions are better than models that do not use a Lifecycle-based approach. Click Show All in any Lifecycle phase to see all of the variables that impacting its model, sorted by Importance.
To optimize performance, we test a range of model parameters and then select the model that maximizes the Model Performance Score. This is accomplished through 10 fold stratified cross-validation.
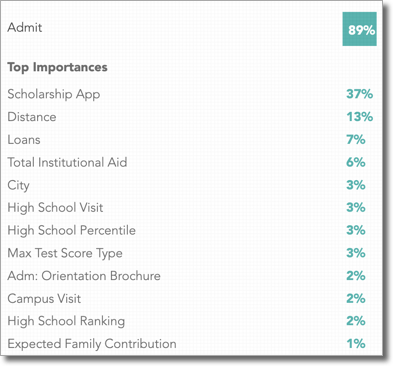
What are Top Importances?
As an output of Othot's Lifecycle-based approach to predictive modeling, users are able to see which variables have more or less impact on predictions in each phase. Variables with a higher percentage are ones that certain values have been observed to lead to higher likelihoods than other variables.
Using an enrollment example, Applicants who have visited campus or live within a certain distance may be known to produce more matriculated students than those who haven't visited or live farther away. Or, a model for Admitted students may show financial aid having more of an impact than a campus visit, or vice versa, depending on the institution.
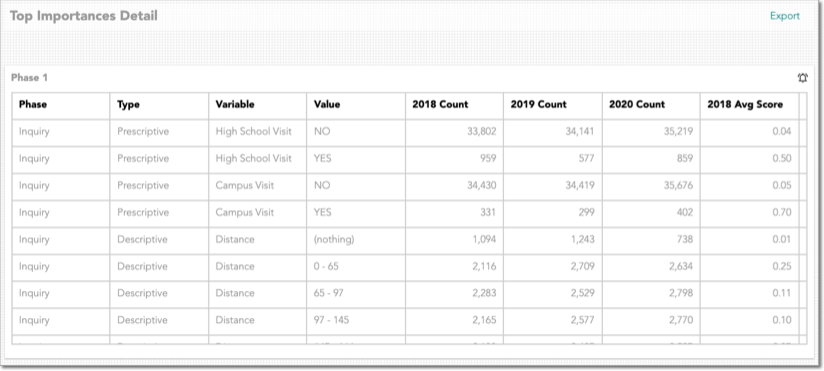
What is the Top Importances Detail?
These tables expand upon the variable-level information found in the Top Importances section by showing the counts, average likelihood score, and average impact each value has in the model by Phase. This information can be especially useful to validate data, as well as identify which characteristics of students tend to have the most significant contributions to their predictions.
Detecting unusual data changes
Quickly discover and be notified of unusual changes to your data, which may lead to invalid predictions. Examples of unusual data changes may include individuals moving backward in lifecycle phases, financial aid awards that have been significantly reduced, or event attendance that has disappeared.
There are two ways to learn if our system detected any unusual data changes.
- In-app notifications. Triggered each time a new potential issue has been logged. You will only receive a notification like this if you are assigned to the user group for suspicious Data Changes. All Othot Super users and any customer user assigned to the group "Data Change" will see them in the notifications side bar. This side bar can be accessed by clicking the little bell in the top right of the screen. When you have "new" notifications, the bell will be Yellow. When you click on that you will see a notification for each variable which had a data change warning.
- Dashboard. Anyone with access to the dashboard can see a new widget and Dashboard Template. The Dashboard template is called Change Data Capture. When you view this Dashboard, you will see a single widget called Data Change Issues. This widget will retain one row variable with a warning for seven days.