Creating Salesforce Reports
Creating a Report
- Click the "Reports" tab.
- The "Reports & Dashboards" page will display existing Reports, organized by folder. To create a new custom report, click the New report button.
- Select the data category to query and the report type within the selected category from the folder list on the left.
For example, if "Schools & Students" is selected, you can query all fields defined for both School and Student objects. Selecting the report type "Students with Applications" would allow you to query all fields in the "School, Student, and Application objects.
- Click Create to advance to the report builder page.
- Specify record selection criteria, using filters, and specify which record fields to include in your report.
- Select Add next to "Filters" to include filtering logic. This will limit report data to only those records that meet your criteria.
By selecting the down arrow on the Add button, you can add a filter, specify the logic applied to multiple filters, and limit the number of rows returned in the report.
Clicking Add will display a filter row to populate. Select the desired field, operator, and criteria for filtering.
- Continue adding filters by repeating these steps, and adding all desired criteria.
- In the "Show" dropdown list, indicate whether you want to include only records that belong to you, your team, or all records.
- In the Date Field, select the value and date range that suits your needs, or select a range of "All Time."
- Remove columns (fields) by clicking and dragging the field name from the "Preview" pane into the "Fields" pane on the left. To remove all fields and start from scratch, select Remove All Columns. You will need to confirm before clearing the Preview pane.
- Add Fields to your report by clicking and dragging field names from the "Fields" pane to the "Preview" pane.
Note: there are success and failure indicators when clicking and dragging from the Fields pane of the previous screen. The green checkbox indicates you have successfully pulled the field into a proper position. Releasing the mouse button here will result in the area being placed into the report. The red forbidden symbol indicates you are not in a proper position to drop the field you've selected. Drag the field to an area where the green checkbox is displayed, then release your mouse button.
- When filters and field selections are finalized, click Run Report to generate the report, or save it by clicking Save.
- To export the report as an Excel spreadsheet or CSV file, click Run Report then select Export Details. Salesforce uses a default naming convention for the export file. You may choose to open the file and rename it before saving the data.
For additional information on creating reports, see the Salesforce Help & Training article Create a Report.
Creating an Exception report
An Exception Report provides a report of all data not contained within the specified parameters. For example, a report of all people in a given group who did not attend a particular event.
- Click the Reports tab.
- The "Reports & Dashboards" page will display existing reports organized by folder. To create a new custom report, click New report.
- Select the data category to query and the report type within the selected category from the folder list on the left.
Note: exception reports are best run using a "Contacts and Accounts" report and then joining to other objects using a cross-filter, but other report types can also be used.
- Click Create to advance to the report builder page.
- Set any desired standard filters and add fields to the report.
- Using cross filters, specify advanced record selection criteria.
- Select the drop-down arrow next to Filters and choose Cross Filter.
- Select the primary object to be filtered, select without, and then select the related object by which to filter.
Example: contacts without Event History. This filter will select all contacts with no Event History.
-
You can click Add Filter underneath the cross filter to further filter within the related object. This will enable you to exclude based on particular criteria within the related object.
Example: subject equals Open House. This additional filter will exclude all contacts who do not have an event history where the subject equals "Open House."
- When filters and field selections are finalized, click Run Report to generate the report.
Creating a custom relative date range in Salesforce reports
You can create custom date ranges in Salesforce reports by using Relative Date Filters. For example, to build a filter with a date range of 'Last 3 days', use the hardcoded date of 'All time.'
Example:
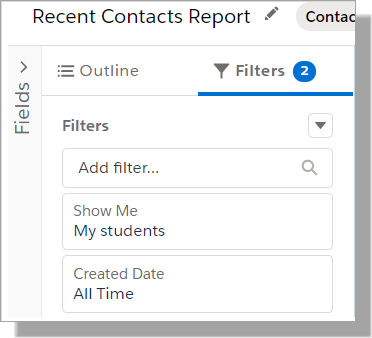
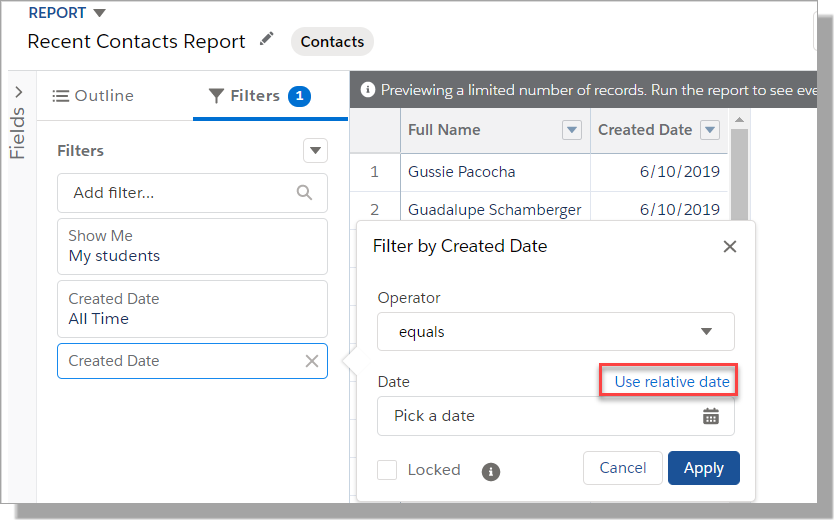
Add another filter using the same Date field, in this example: Created Date and click Use Relative Date:
Enter Last 3 days and click Apply.
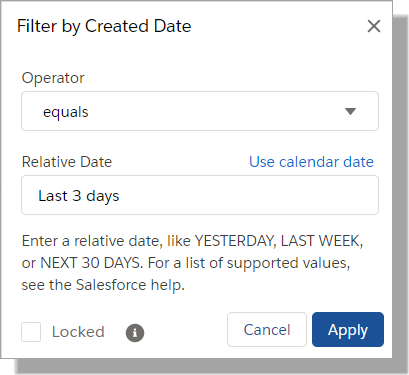
For more information on Relative Date Filters, see the Salesforce Help & Training article: Relative Date Filter Reference.
Setting Up a Dashboard Report
Administrators and users with the "Manage Dashboards" permission can create, edit, and delete Dashboards.
-
Before creating Dashboards, you must create the custom Report(s) containing the data you want to display (see How To Create a Report).
Note: Dashboard components use the Summary Fields and Groups defined in custom Reports. Store these reports in folders your intended Dashboard viewers can access.
- Click on the "Dashboards" tab.
- Click Go to Dashboard List.
- Click New Dashboard.
- Choose the desired Chart Type by dragging it to the rightmost Dashboard rectangle.
- In the "Data Sources" tab, select the Report you would like to use for your data source.
- Drag the report name to the rightmost Dashboard rectangle to add it as the data source.
- Click the wrench icon next to the chart type in the Dashboard rectangle. Here you can set the options for the chart, including the number of records listed, along with the sorting order.
- Save the Dashboard report. When saving, save the Dashboard in a public folder so other users can access it.
- To display the Dashboard report on a homepage Dashboard, the Dashboard report must be in the first row of the Dashboard (i.e. it must be one of the first three Dashboard reports).
Sharing a Report
Making a Report Public
Administrators or users with the ”Manage Public Reports” and “Create and Customize Reports” permissions can create custom reports that all users can view. This is done by making the report “Public.”
- Open or create a Report, as described in How To Create a Report.
- Click Save (new Report) or Save As.
- In the "Report Save" dialog box, give the report a name.
- Choose a public report folder from the Report Folder pick list.
- Click Save.
Report Folders
Administrators can also organize the Reports tab by creating custom report folders, filing reports into different folders, and configuring which groups of users have access to the different folders. See the Reports FAQ for more information about folders.
Sharing a Report with a Non-Salesforce User
If the individual you wish to share the report with is not a Salesforce user, see the Reports FAQ for instructions.