Campaign and Email Analytics
Overview
Campaign analytics provide insight into the target audience and effectiveness of your campaigns. Using analytics, you can:
- Visualize the engagement driven by each campaign over time.
- Measure direct form submission conversions across all elements.
- Visualize the contribution of each campaign against overall goals.
- Identify which emails drove the most conversions.
Accessing & Navigating Campaign Analytics
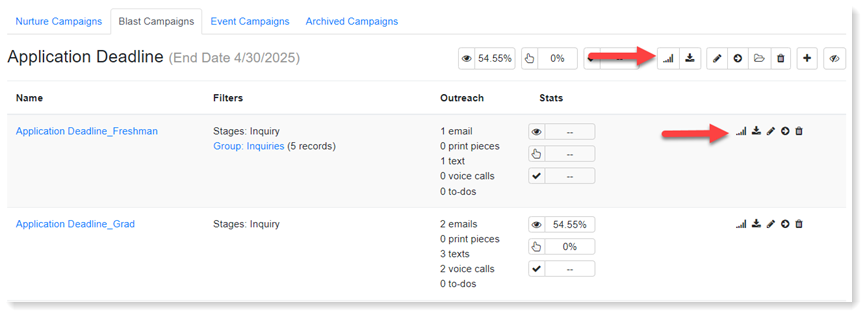
Analytics are unique to each campaign. You can navigate to the metrics a few ways:
- Click View Campaign Stats on the campaign.
- In the track, click Track and select View Statistics from the drop-down.
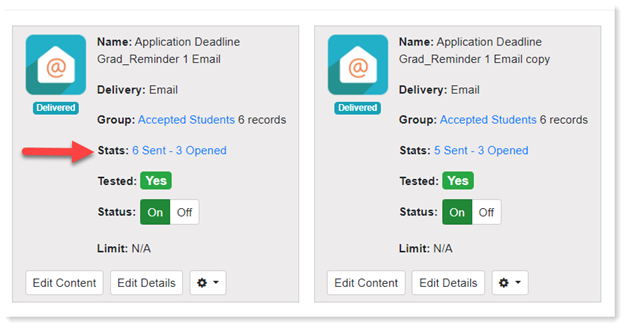
- Click Stats on the individual outreach item.
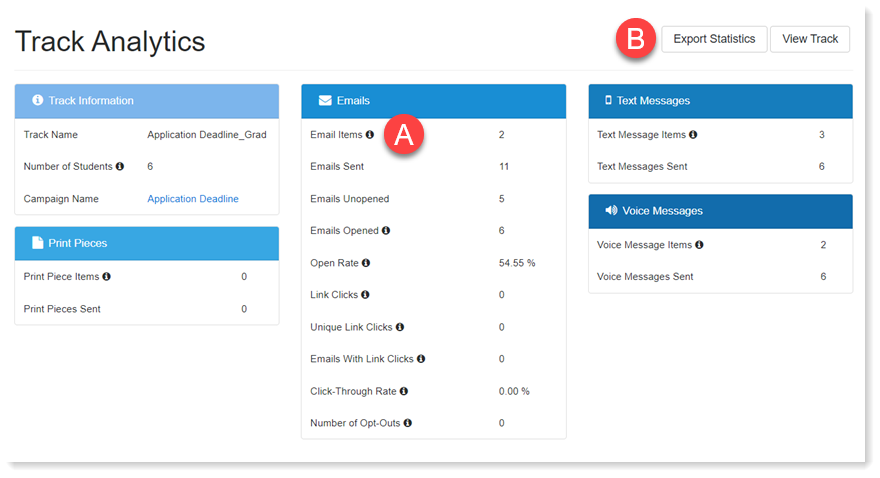
Review the legend below to learn how to navigate the Campaign Analytics page. Depending on whether you are looking at an entire campaign, track, or individual outreach item, this screen may vary slightly.
- A: Hover over the information icon for a definition of the metric.
- B: Click Export Statistics to view the statistics in an Excel file.
Understanding Reports, Charts, and Tables
To access a report, click the drop-down below the Summary Table to select from various reports.
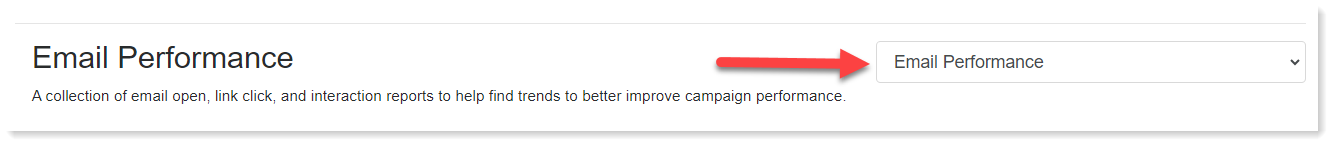
Email Performance Reports
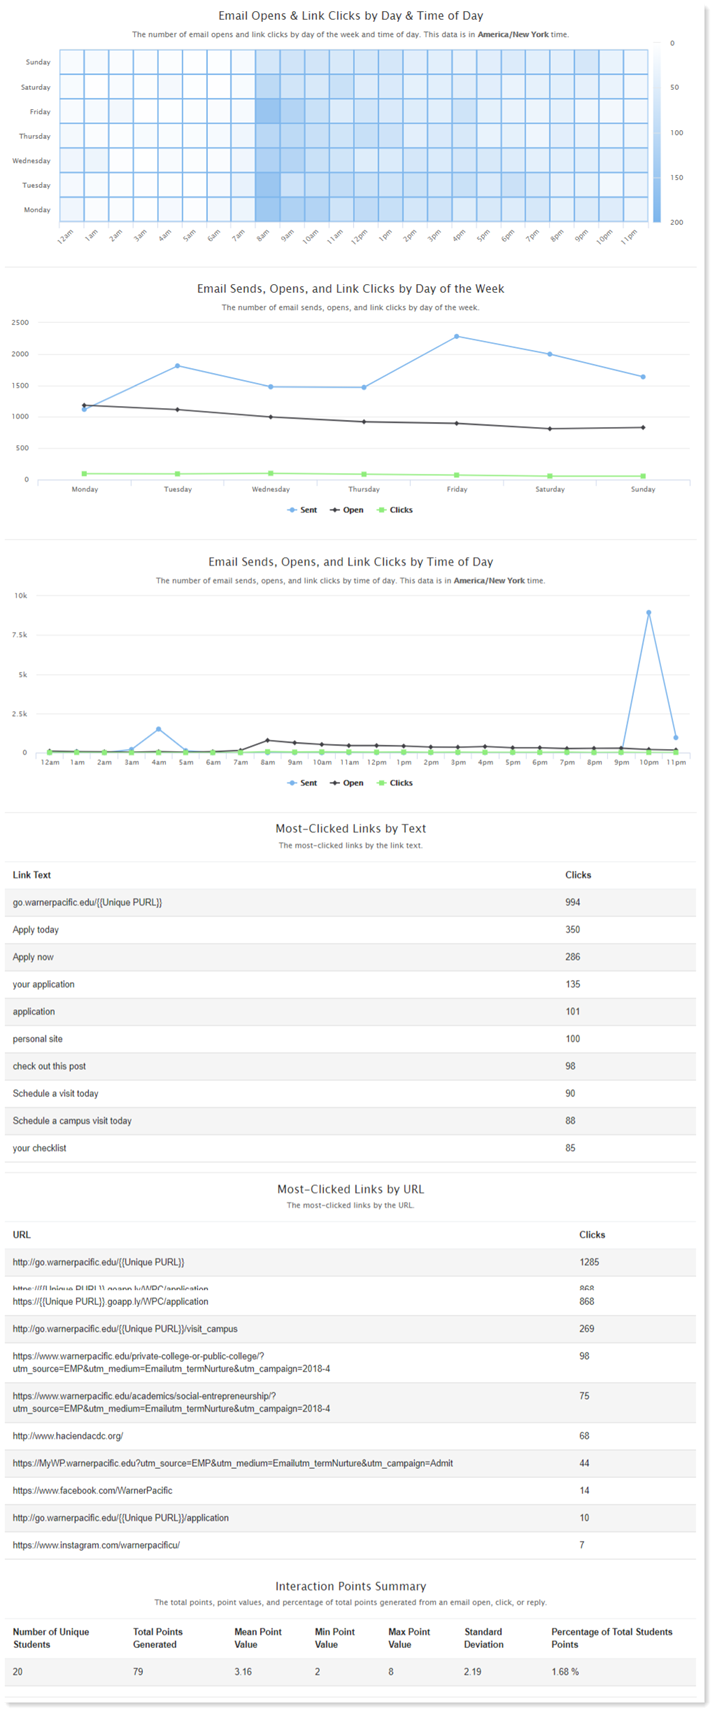
A collection of email open, link click, and interaction reports show trends to better improve your campaign performance. Reports include:
- Email Opens & Link Clicks by Day & Time of Day
- Email Sends, Opens, and Link Clicks by Day of the Week
- Email Sends, Opens, and Link Clicks by Time of Day
- Most-Clicked Links by Text
- Most-Clicked Links by URL
- Interaction Points Summary
Direct Stage Conversion Reports
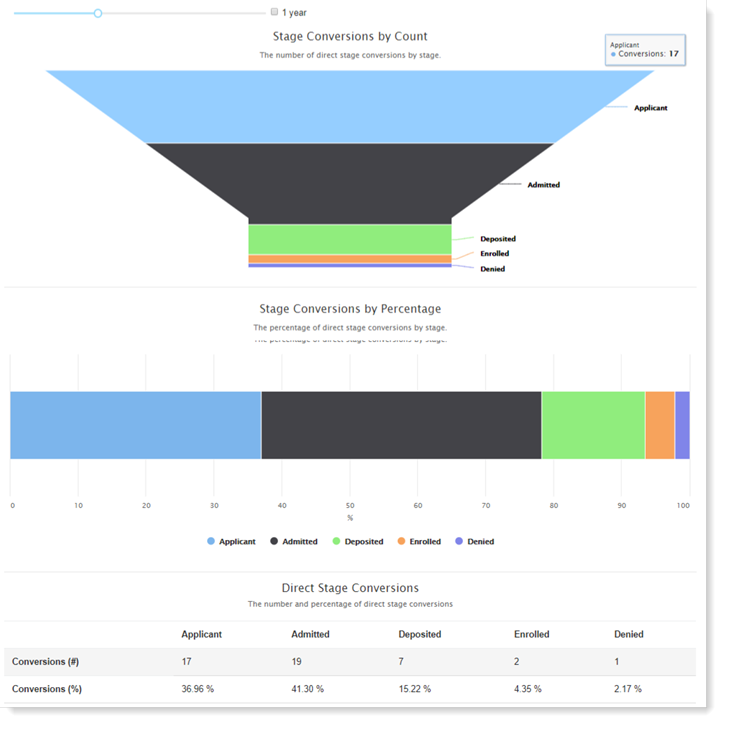
A stage change after an email link click is considered a direct stage conversion. Reports include:
- Stage Conversions by Count
- Stage Conversions by Percentage
The length of time between a click and stage change can be adjusted from 1 to 365 days. This timeframe is used for all the charts in the section.
Indirect Stage Conversion Reports
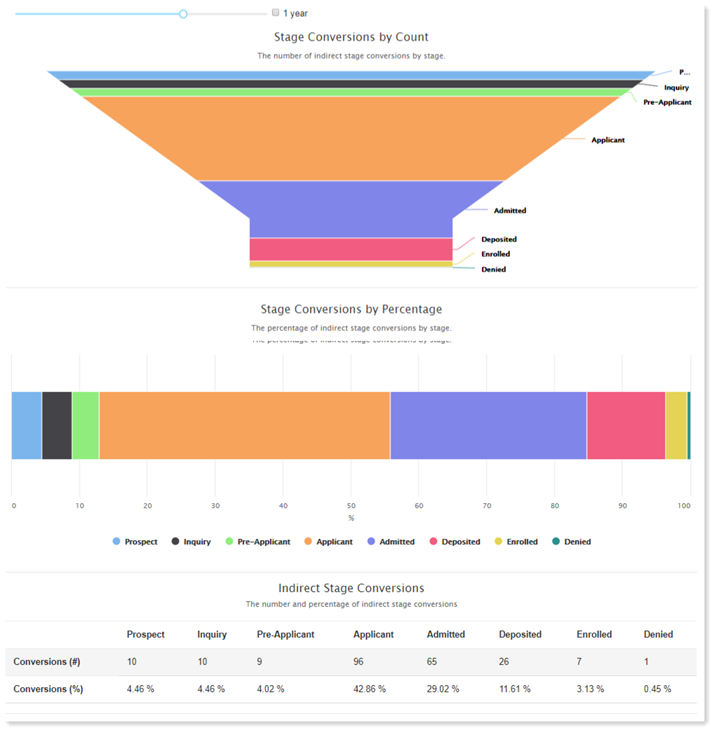
A stage change after a sent email, print piece, text message, or voice message is considered an indirect stage conversion. Reports include:
- Stage Conversions by Count
- Stage Conversions by Percent
The length of time between a send and stage change can be adjusted from 1 to 365 days. This timeframe is used for all the charts in the section.
Direct Form Conversion Reports
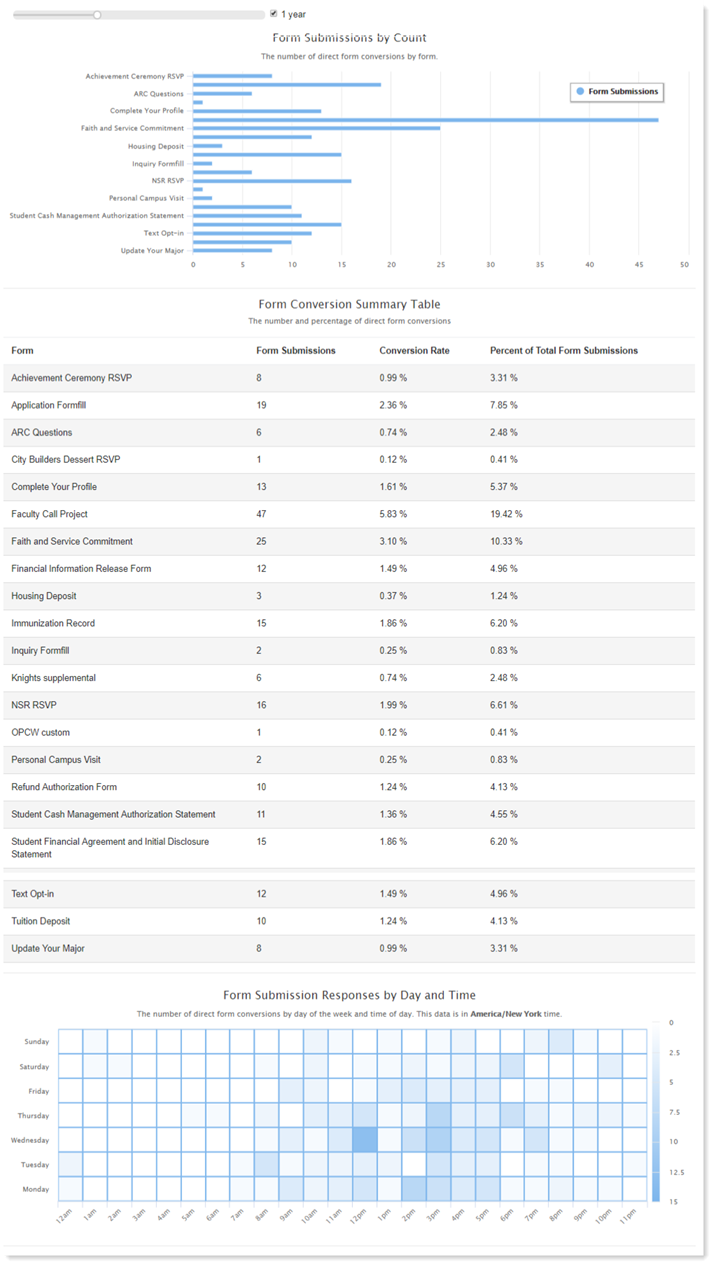
A form, application, and event sign-up submission after an email link click is considered a direct form conversion. Reports include:
- Form Submissions by Count
- Form Conversion Summary Table
- Form Submission Responses by Day and Time
The length of time between a click and stage change can be adjusted from 1 to 365 days. This timeframe is used for all the charts in the section.
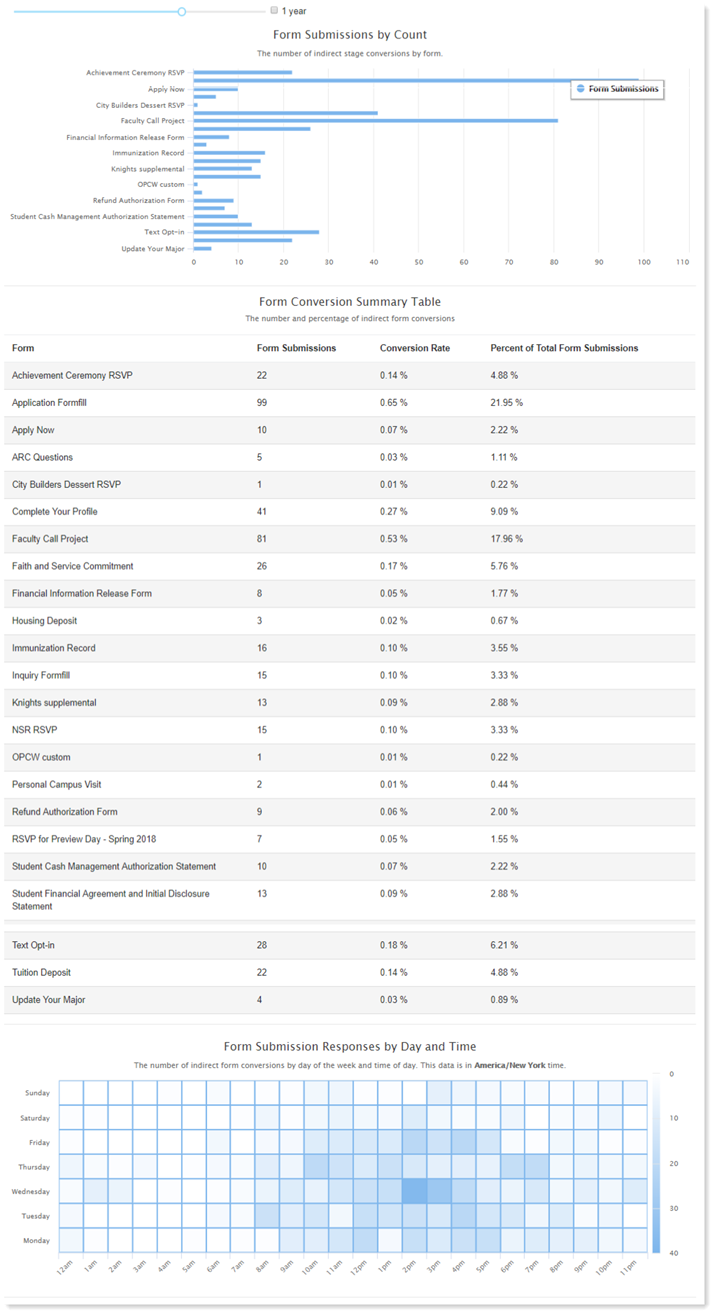
Indirect Form Conversions
A form, application, and event sign-up submission after a sent email, print piece, text message, or voice message is considered an indirect form conversion. Reports include:
- Form Submission by Count
- Form Conversion Summary Table
- Form Submission Responses by Day and Time
The length of time between a send and stage change can be adjusted from 1 to 365 days. This timeframe is used for all the charts in the section.
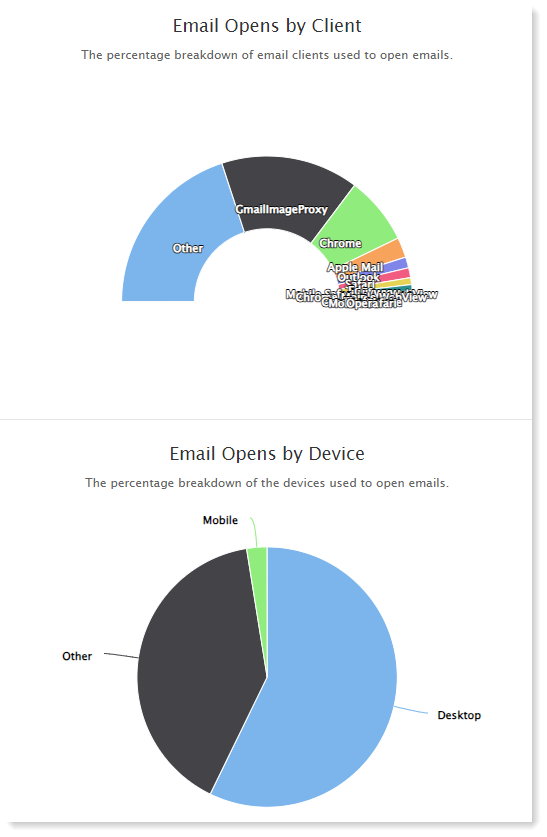
Email Devices & Clients
A breakdown of devices and clients used to open emails.
- Email Opens by Client
- Email Opens by Device
Email Analytics
Email Analytics provides additional visuals and charts for all emails sent from EMP. Unlike Campaign Analytics, Email Analytics provides comprehensive metrics for your entire EMP instance and is not specific to a campaign, track, or individual outreach item.

Use the filters to search for the email type and date range you want to analyze.
- Email Type: various emails sent from EMP. They are defined as follows:
- Campaign: emails sent from your Nurture, Blast, or Event campaigns.
- Record: emails sent individually to a student (e.g., a 1 to 1 email).
- User Notification: emails sent to users informing them of form submissions, event registrations, To-do's, etc.
- Password Reset: emails sent to users updating their password.
- Auto Responder: emails automatically sent to students when they perform the selected interaction.
- Date Range: select from a predefined list of ranges or customize your start and end date.
- Email Statuses: once you send emails in EMP, you can track the email status. These statuses include:
- Processed: the messages sent using EMP.
- Delivered: the recipient's email service received the message.
- Failed: the message was not sent.
- Clicks: the recipient received the message, opened it, and clicked a link or image.
- Opens: the recipient received the message and opened it.
- Complaints: the recipient reported the email as spam.
The Email Analytics line graphs connect individual data points to display the values over a specified time period, providing a helpful tool for understanding how your email statistics change over time.
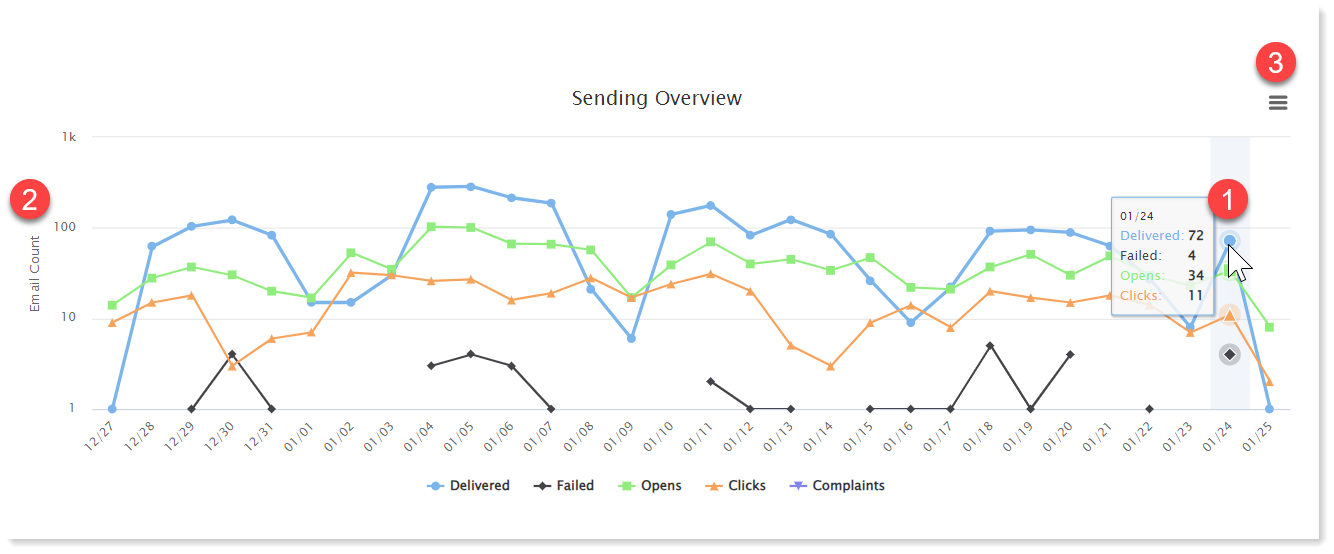
- Graph: hover over a data point to see metrics for that specific day.
- Axes: values that are being compared.
- Option stack: print or download the chart.