Working with the Dashboard
What is the Outcomes Dashboard?
The Dashboard in Outcomes is the landing page where you arrive after logging in. Dashboards are created as Reports, after which administrators can assign them to other users to serve as their landing page.

Dashboards provide you with charts that allow you to:
- view key information in an easily digestible manner.
- determine your progress on current projects and identify what needs to be done.
- easily navigate to the appropriate section to continue working.
There are several components that make up the Dashboard:

- Navigation Menu: use this menu to switch between the different sections available in Outcomes. Click << to collapse the menu for a larger workspace.
- Dashboard: the charts added in this section are configurable and are dependent on your Dashboard settings. Click on any chart to interact with it. With appropriate permissions, you can add, remove, and configure charts as desired.
- Edit Dashboard: where allowed by an administrator, you can use this button to personalize your Dashboard. After editing your Dashboard, if an administrator updates the report that serves as your Dashboard, the changes won't be applied until you click this button and then click Revert.
- Activity Menu: from this area, you can access your email history, your available downloads, and your profile settings.
- Settings Menu: use this menu to review and adjust your Outcomes Settings.
- Help Menu: use this menu to access the Outcomes Help Center.
- My Account: use this menu to access your account settings, switch the organization you're viewing, or sign out of Outcomes.
Building Reports to Use as Dashboards
In Outcomes, Dashboards are simply reports that have been configured to appear as the landing page for users. So to configure a Dashboard, you'll need to:
- Design a report containing the information you'd like to appear on your dashboard.
- Assign the Dashboard to your desired role. To do this:
- Navigate to the Settings menu and click Roles.
- Click Create Role to start from scratch, or click on one of the role headers to edit an existing Role.

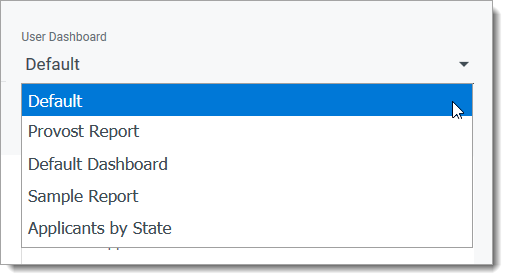
- Under User Dashboard, select which Report you'd like to use as the Dashboard for the users in this Role.
- Continue making any other needed adjustments, and Save Changes or Create Role.
Once you have assigned this Dashboard, all users in the applicable role will see your desired Report upon logging into the software. If you edit a Report that is used as a Dashboard for other users, their Dashboard will change to match your edits. If users have made any adjustments to their Dashboard, the changes won't impact them until they click the edit pencil on the Dashboard and then click Revert.
Working with Goals
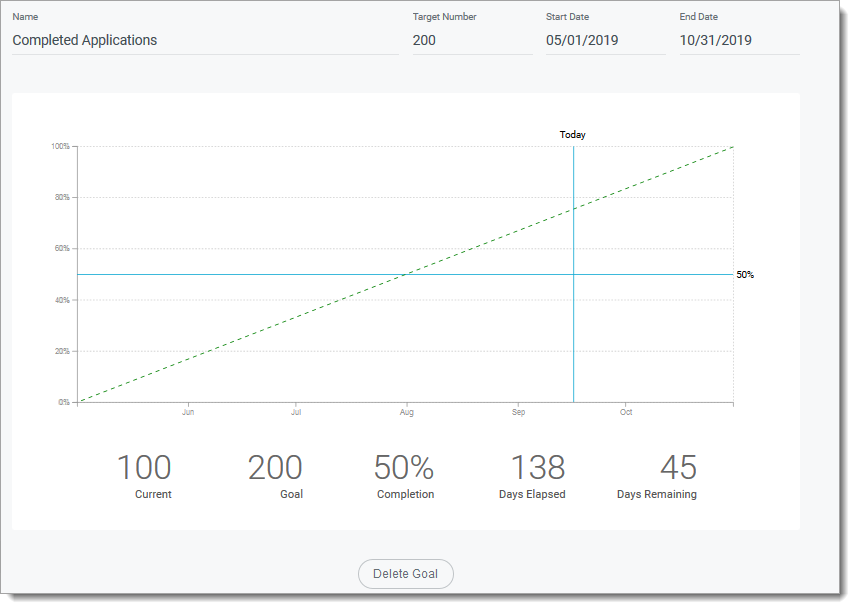
Throughout the year, you may have projects for which you have a specific target in mind. For example, you may have a goal of accepting 50 applicants to one of your programs. In Outcomes, you can establish your goal and your target completion date by creating a Student Goal. The software tracks your progress toward achieving that goal.
Additionally, where you want to keep track of individual people instead of applications, you can use Contact Goals to set targets for contacts, even if they have not applied. For example, you may have a goal of 500 people who submit an inquiry form.
To build a goal:
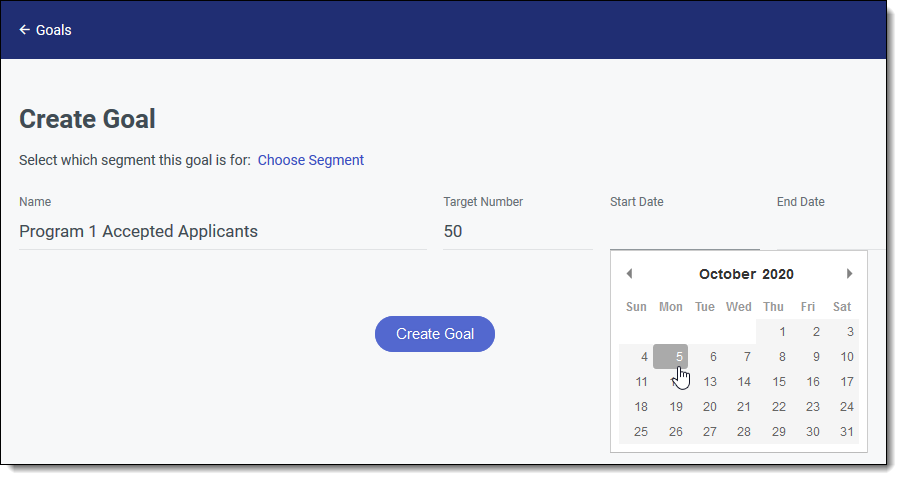
- From the Navigation Menu, Reporting, then select Goals.
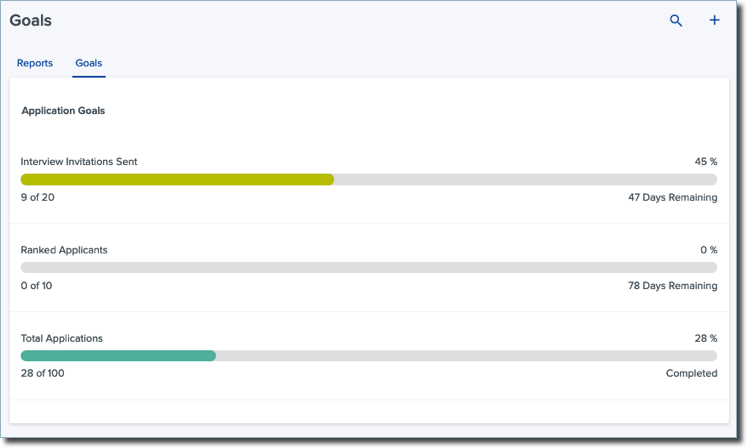
- From the Goals page, you can review your existing Goals and your progress. Click Create Goal to add a new goal.
- Select which segment to associate this goal with. Selecting an Application segment creates a student goal, while selecting a Contact segment creates a contact goal.
- Enter a name and target number for your goal. Then add your start and end dates.
- Click Create Goal to save this goal.
Once you've created a Goal, you can view it from the Goals page.
For more details, click the Goal. This opens a page that gives more information regarding your progress towards completing the goal.
When working with Goals you can:
- create as many as you want.
- use the same segment with different Goals (e.g., working with different target numbers or start and end dates.)
- edit them by clicking in the appropriate field and typing a new name, target number, or date.
- add goals to Reports and Dashboards as desired.
To remove a Goal, click Delete Goal.
Customizing the Dashboard
Administrators in Outcomes can create Reports to use as Dashboards, and assign those Dashboards to users through the Roles feature.
If your permissions allow for it, you can adjust what appears on your Dashboard. To do this:
- Navigate to your Dashboard and click the Edit pencil.

- From here, you can add new charts or adjust any of the existing charts that appear on your dashboard. If you create a new chart using this method, the chart will be deleted if you revert your changes (see step 5). Changes you can make to existing charts include:
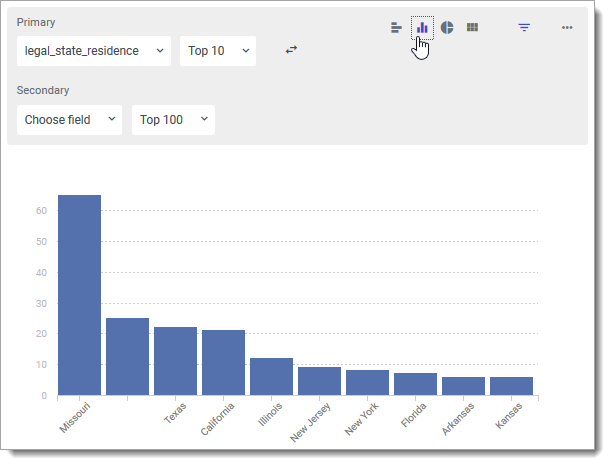
- Adjusting the data that is displayed in a chart by clicking the drop-down menus.

- Adjusting the style of the chart by clicking the appropriate chart icon.
- Adding new filters by clicking the filter icon, then the Add Filter link.

- Deleting or duplicating charts by clicking the More Options button and selecting the appropriate option.

- Adjusting the data that is displayed in a chart by clicking the drop-down menus.
- To reorder how the charts appear on your dashboard:
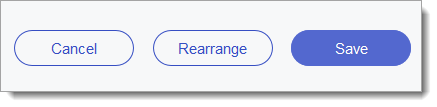
- Click Rearrange.
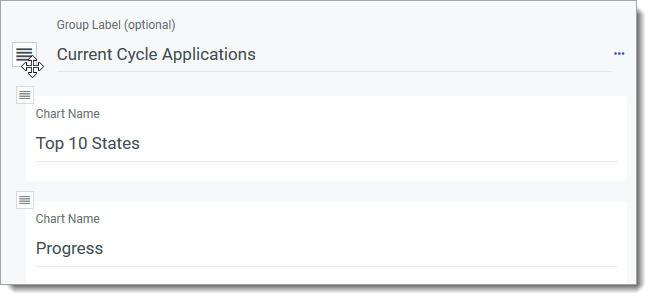
- Click the top left corner of any chart or group to rearrange it.
- When you're done adjusting the arrangement, click Done Rearranging.

- Click Rearrange.
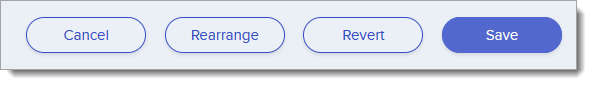
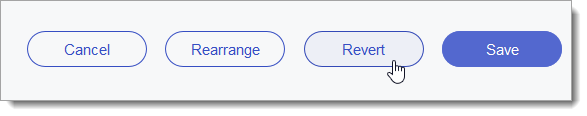
- To cancel the edits you've made, click Cancel. To keep them, click Save.
- After saving adjustments, you can undo them by clicking Revert. This deletes any changes or new charts you created through the Dashboard edit.
If you personalize your Dashboard, it becomes your own customized version of the Dashboard assigned to you by an administrator. An administrator can still add or remove charts as necessary.