Funnel Charts
Overview
Funnel Charts display the most critical metrics for admissions offices. This reporting tool is used to generate both current and point-in-time results. Point-in-time reporting displays a historical view that compares numbers for the current entry year to numbers in previous years.
Creating a Funnel Chart
- From the top navigation bar, click Analytics, then Funnel Charts.
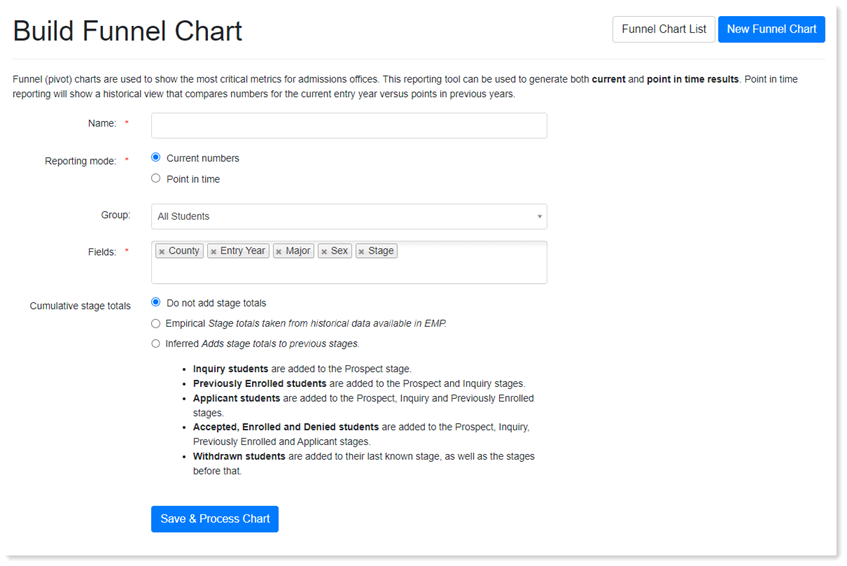
- Click New Funnel Chart.
- Complete the required prompts and Save.
- When selecting the Cumulative stage totals, consider the following options:
- Do not add stage totals: review current data.
- Empirical: track the stages reached by students. For example, you do not want your stealth applicants counted as inquiries or prospects.
- Inferred: review data assuming every student went through the full enrollment funnel.
- When selecting the Cumulative stage totals, consider the following options: